Daily UI #018 - Analytics Chart

Daily UI #018 - Analytics Chart
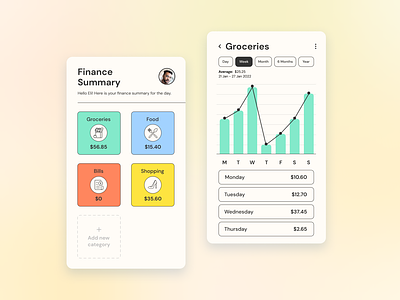
Day 18's challenge is to design an analytics chart. I designed one for tracking your finance! It has filters at the top of the screen so you can see an overview of your spendings for the day, week, month, 6 months and year. There is a graph to show the increase and decrease in spendings for those who prefer something visual. I also included the actual amounts spent each day! #DailyUI