Ant Design Charts for Figma

My new product - Ant Design Charts for Figma is now available!
The powerful library of charts and graphs based on the Ant Design Charts react library.
Design dashboards, analytics, presentations, and more with the set of the most common data visualization patterns that are simple to use and customize.
🌎 Visit the official website to learn more -> https://antforfigma.com/ant-design-charts-for-figma
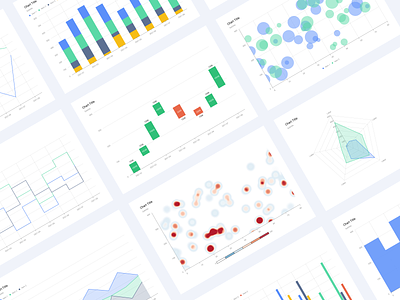
80+ Scalable Charts
In the UI kit, you will find multiple charts within different categories. Line charts, column charts, bar charts, pie charts, area charts, scatter charts, heatmap charts, radar charts are included.
Handcrafted Components
Charts are well-organized Figma components built from scratch. You can easily grab them from the assets panel and use them in your designs.
Auto Layout and Variants
Most of the components were built with auto layout and variants, making them easy to maintain and more intuitive to use.
Apply Your Style
The typography and colors used in charts were created with Figma styles. Whenever you change a style's properties - Figma will apply those changes to any objects using that style.
Modify with Ease
Thanks to a well-thought component structure, you can add your own data visualizations or modify existing charts with ease.
Free Updates
All major Figma or Ant Design Charts updates will be added to the UI kit. Updates are free, and you will receive the new files via email.