Occupancy & Social Distancing Dashboard 😷

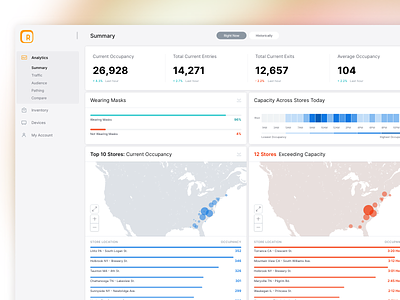
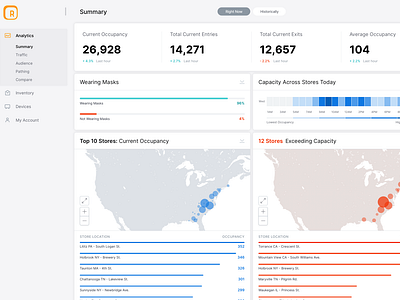


One of the larger projects I've been working on over a pretty long time: an analysis dashboard for real world sensor networks. Capable of tracking and analysing locations data through cameras, wifi and bluetooth sensors, etc.
This one is the main summary dashboard fed with live data from various store locations - showing the current capacity, percentages of people wearing masks, etc.
More on my website.