Video Game visualisation

I am finally updating my Dribbble account with some shots of this great project I worked on at Dataveyes.
This project was commissioned by La Cité des Sciences et de l'Industrie in Paris, a science museum which currently runs a 10-month exhibition about video games.
The installation shows the 15 trending topics within the French video game scene. Each of them is visualized by a planet that grows, lives and dies according to its number of related articles across news channels and its popularity on social networks (Twitter and Facebook). The application runs on a 63" screen in the exhibition until August.
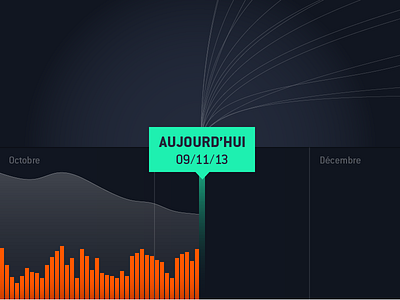
This snapshot captures the timeline placed at the bottom of the visualisation, global shot to come :)
Complete case study about the projet : http://dataveyes.com/#!/en/case-studies/actualites