Charts UI kit, Infographic templates & Data Visualization kit


Charts UI kit as Figma templates library
A bullet graph is a variation of a bar graph developed by Stephen Few. Seemingly inspired by the traditional thermometer charts and progress bars found in many dashboards, the bullet graph serves as a replacement for dashboard gauges and meters
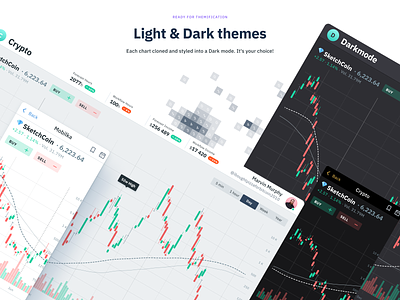
Figma charts library made of components. Contains most common data visualization patterns from simple bar charts to complicated heatmaps and financial candlesticks. Fits for dashboards, presentations, visualizations or any other type of data-design projects.
Figma Charts & Infographics UI kit (Community).fig
30 MB