


-
3819.9k
-
609.8k
-
3514.3k
-
1199.1k
-
202.5k
-
201.1k
-
13413
-
132.1k
-
20761
-
0554
-
279.6k
-
216.2k
-
21824.8k
-
7683
-
131.9k
-
6603
-
234.6k


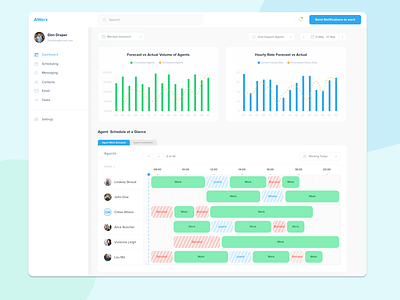
![Socialbakers Analytics [concept] analtyics app charts dashboard flat interaction material redesign ui web website](https://cdn.dribbble.com/users/24011/screenshots/2279959/comp-1_still_2x.gif?resize=400x0)
![Socialbakers Analytics [concept] analtyics app charts dashboard flat interaction material redesign ui web website](https://cdn.dribbble.com/users/24011/screenshots/2279959/comp-1_still_2x.gif?resize=400x300&vertical=center)


Loading more…


