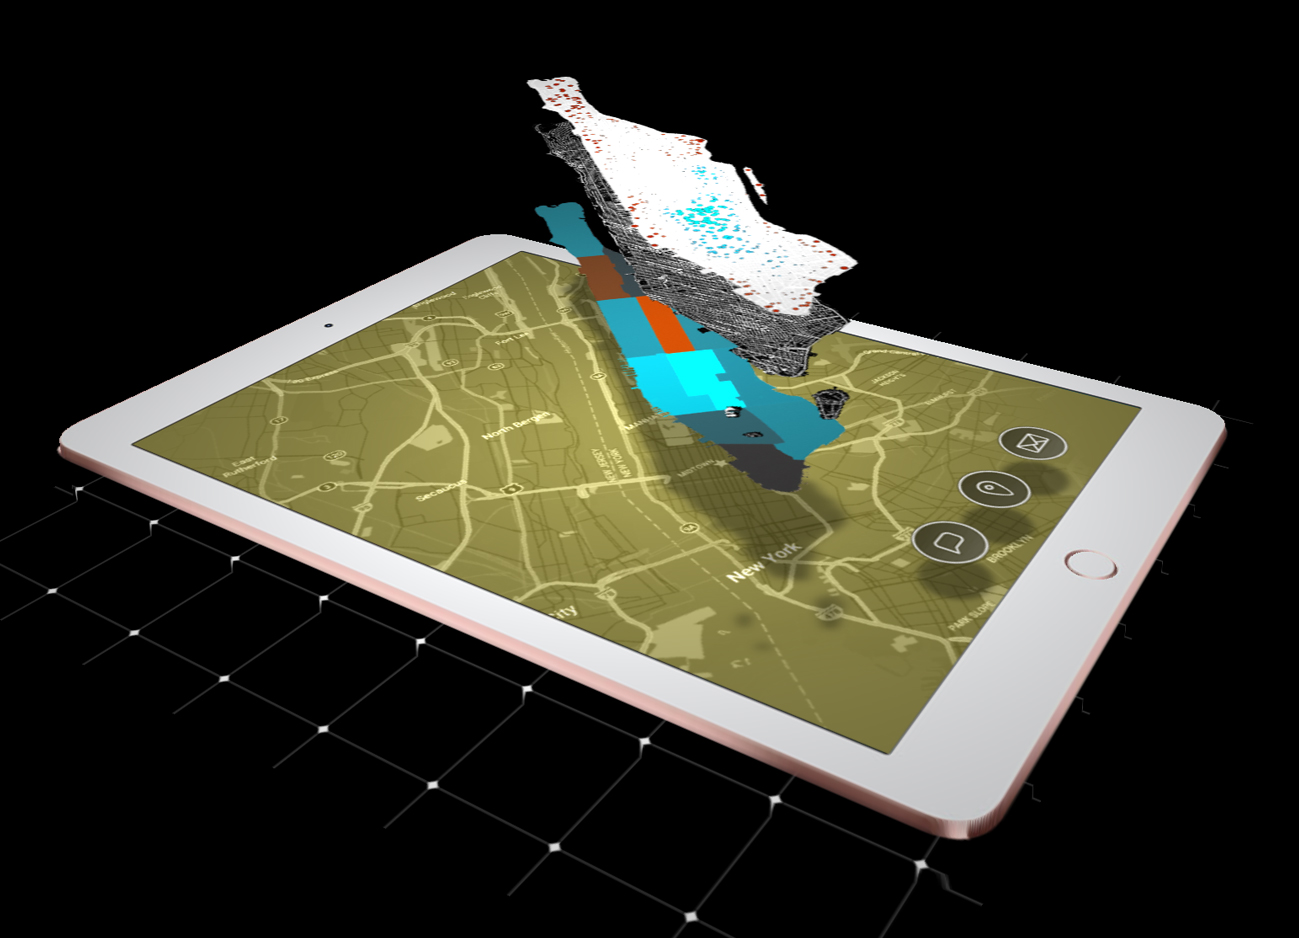
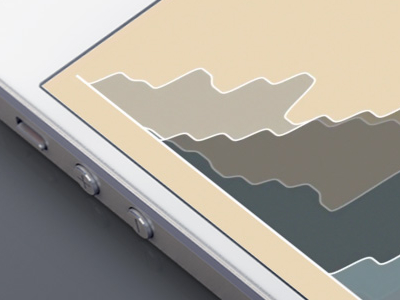
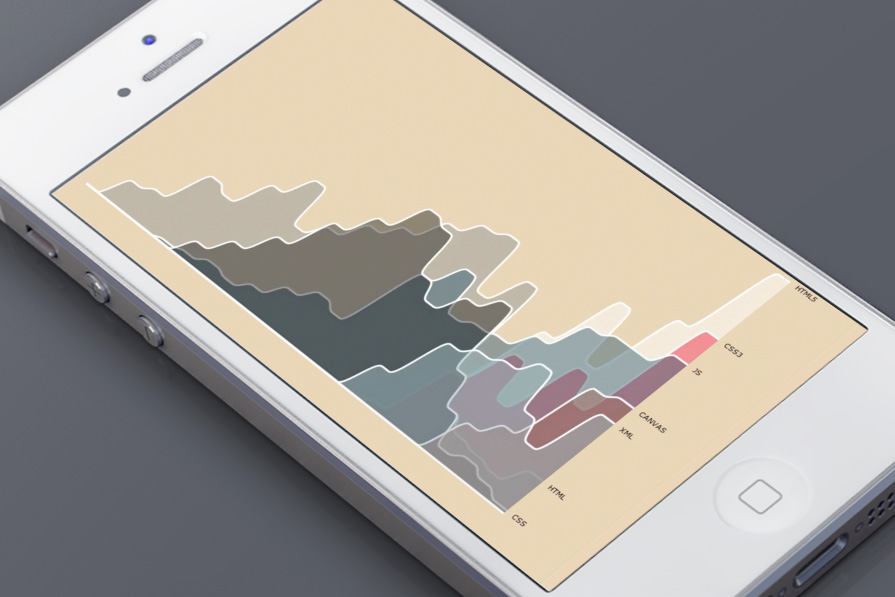
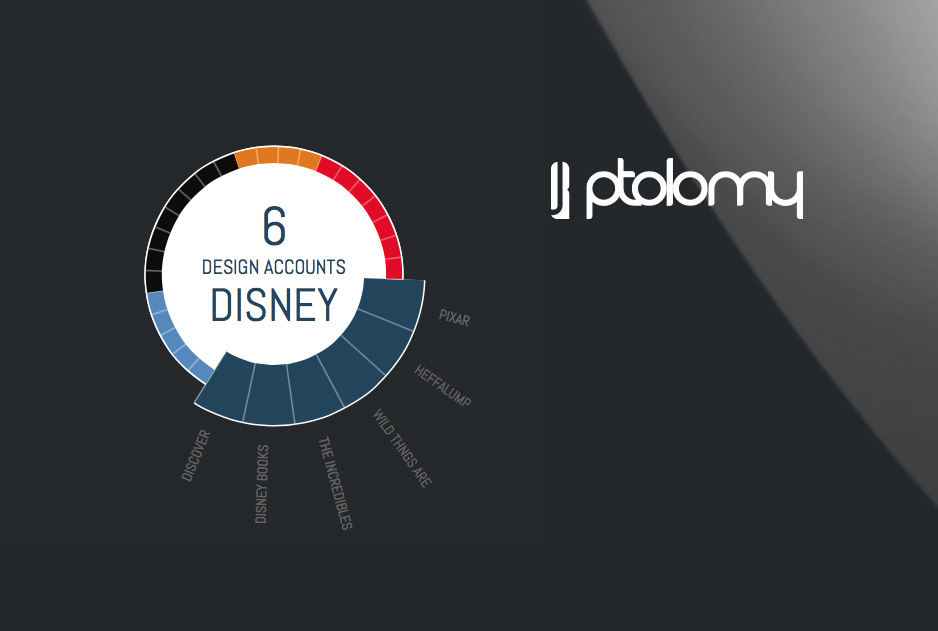
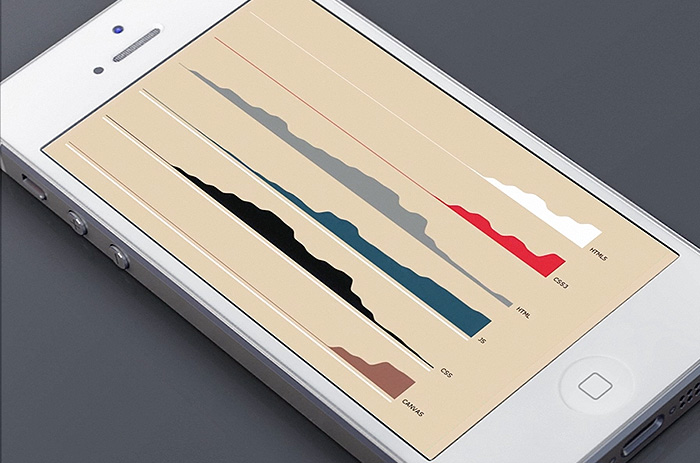
Data Visualization
9 Shots • 12 Attachments
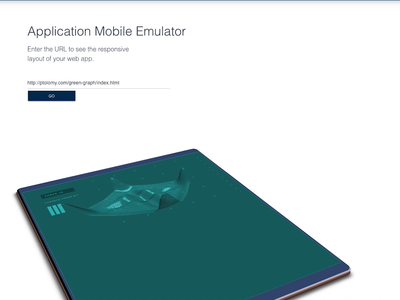
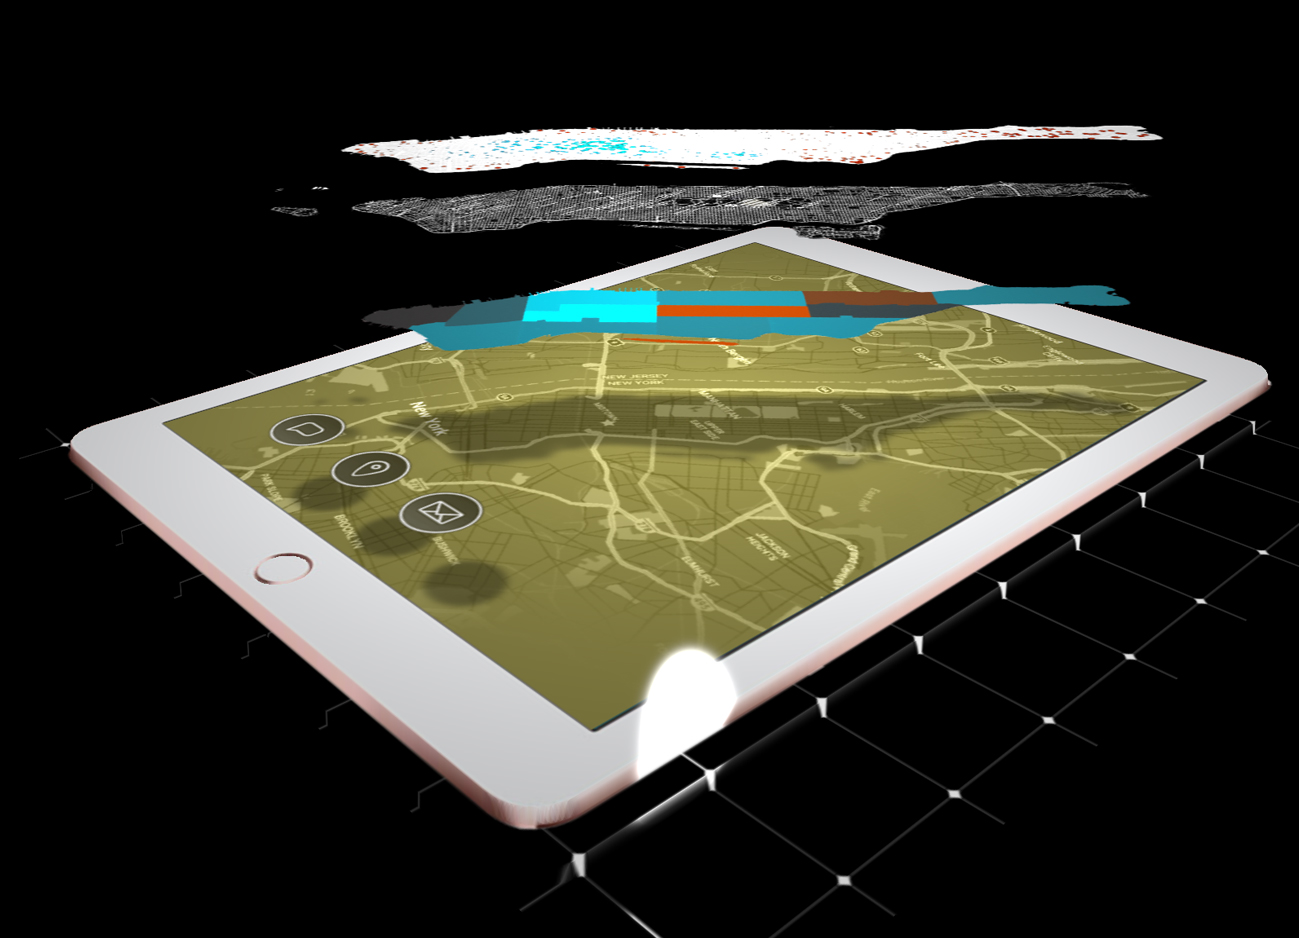
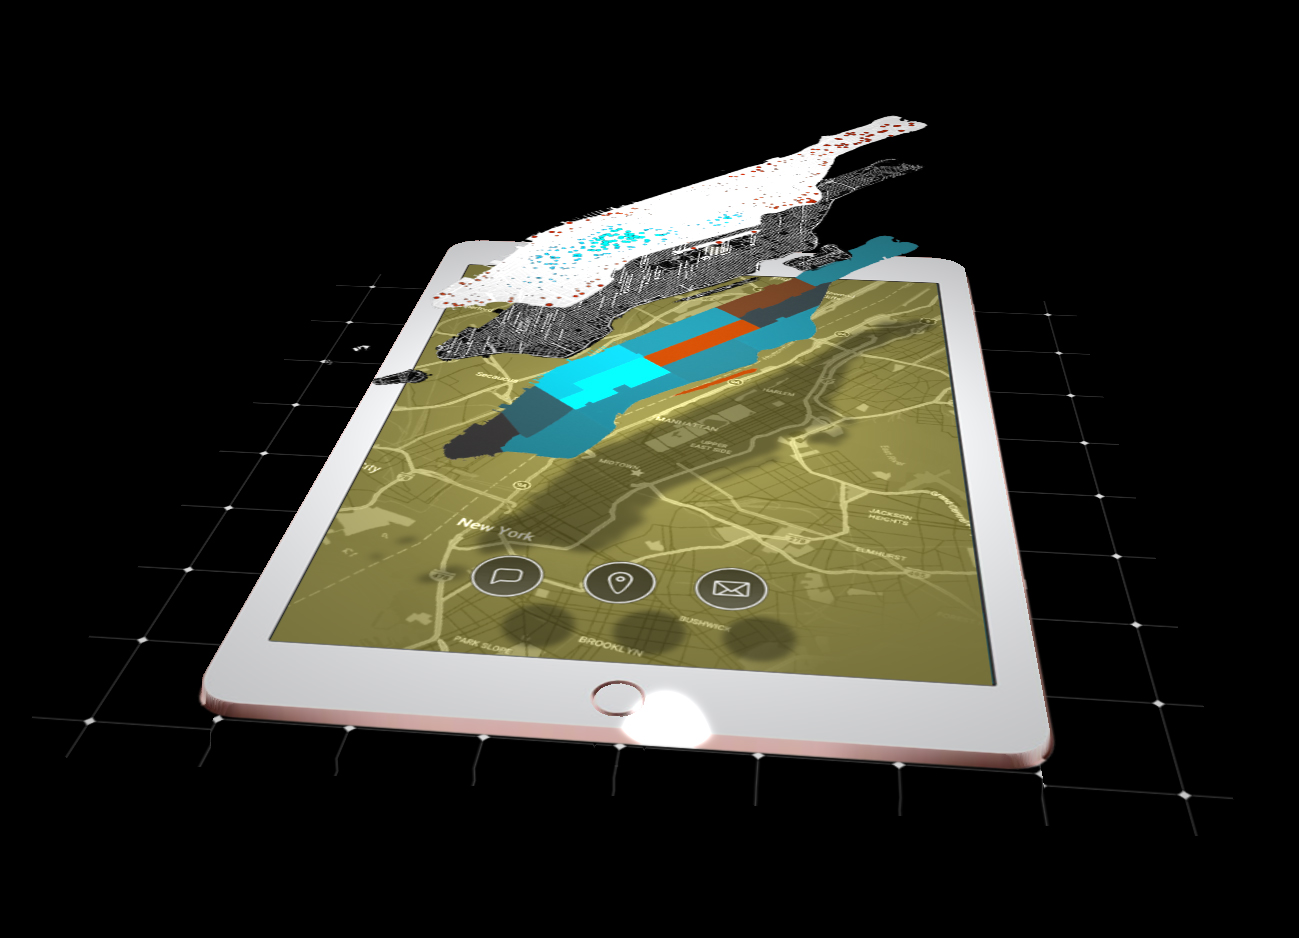
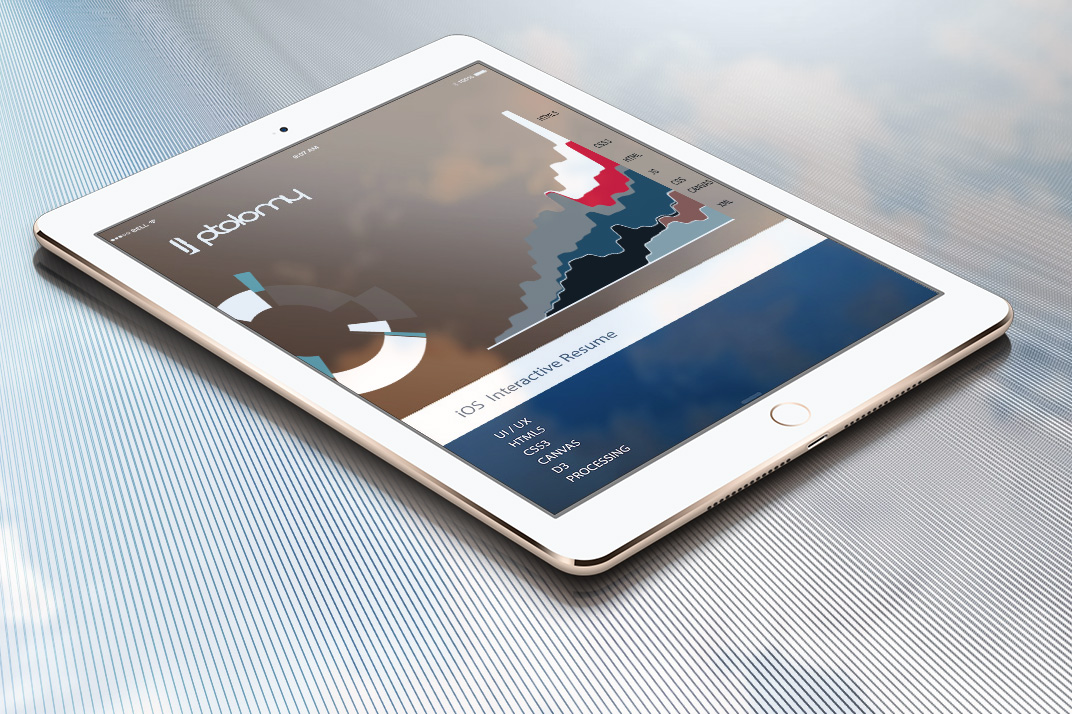
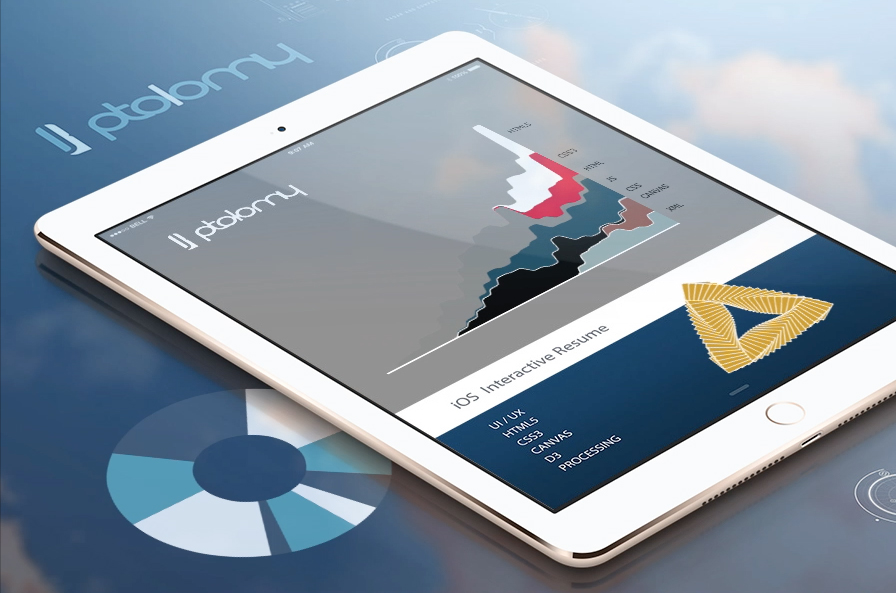
Visualization Showcase for PTOLOMY.com
Visualizing Invisible Mobile infrastructures
May 08, 2017
Visualizing Invisible Mobile infrastructures in IOS: In this IOS simulation overlaid maps of manhattan are displayed in WedGl to reveal selectable data sets.
Client List
February 28, 2017
REEL 2022: https://www.youtube.com/watch?v=N8tW71CmcNw UI-UX Developer specializing in the Design, Interaction and Visualization for companies including:Graphics News Editor • Presentation Graphics Analyst • SCIENTIFIC AMERICAN – Scienc...
Geomorphometry - WebGL
September 14, 2016
In simple terms, geomorphometry aims at extracting (land) surface parameters (morphometric, hydrological, climatic etc.) and objects (watersheds, stream networks, landforms etc.) using input digital land surface model (also known as digi...
1 attachment
UI-UX Resume Visualization in iOS
October 13, 2015
UI-UX Resume Visualization in iOS. The resume skills chart shows the learning progression from 1994 to 2016 of HTML5, CSS3, XML, Canvas Elements, Action Script, D3.js, Processing.js, Json, and iOS.
1 attachment
Data Driven Resume Visualization
July 17, 2015
The resume skills chart shows the learning progress from 1994 to 2016 of HTML5, CSS3, XML, Canvas Elements, Action Script, D3.js, Processing.js, Json, and iOS.
1 attachment
My iOS Resume Visualized in D3.JS
April 17, 2015
Interactive Resume Visualization in iOS: HTML5, Canvas elements, CSS3, D3.js. The resume skills chart shows the learning progression from 1994 to present of HTML5, CSS3, XML, Canvas Elements, Action Script, D3.js, Processing.js, Json, ...
2 attachments
Processing.JS iOS Resume Visualization
October 11, 2014
REEL 2020: https://www.youtube.com/watch?v=Wx15E8stUEE My Resume visualized using Processing.JS, CSS, HTML5: • The Wall Street Journal – Graphics News Editor • Goldman Sachs – Presentation Graphics Analyst • Ogilvy Interactive – UI De...
1 attachment
Resume: Skills Animating Chart -1994-2016
September 02, 2014
HTML5, CSS3, CANVAS, ACTIONSCRIPT, PROCESSING, JSON, D3-JS. and Data Visualization. Data driven chart in D3.js, of programing skills from 1993 to 2016. This animation shows overlapping aspects of a selection of Internet programing langu...