Animation, Leadership, UI / Visual Design, Product Design, UX Design / Research, Web Design
4 Shots
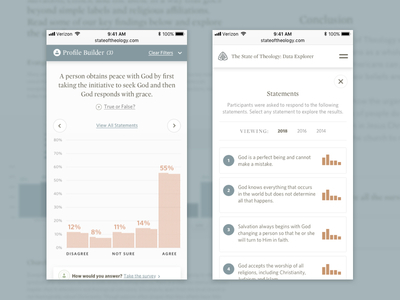
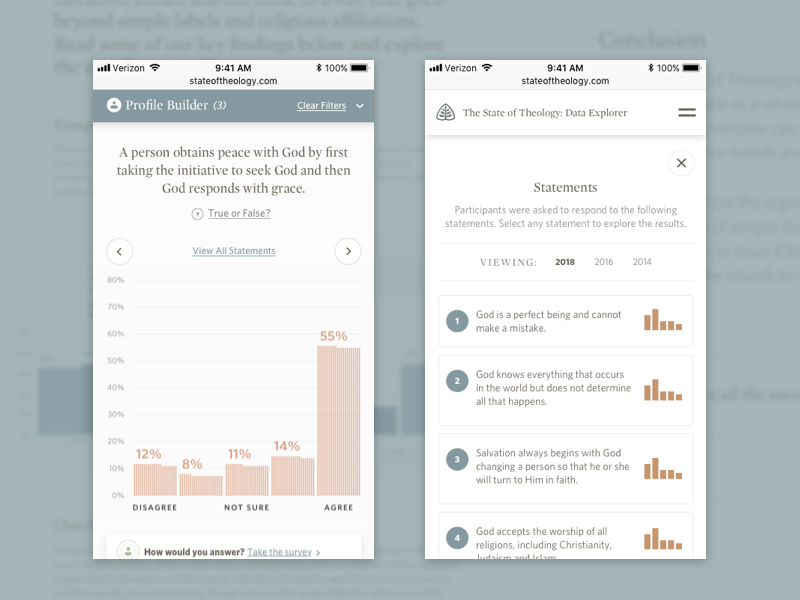
We designed a data-driven experience where users could explore 3,000 survey participants’ answers.
envylabs.com/work/ligonierFebruary 20, 2019
As part of Ligonier's 2018 State of Theology update, we designed a survey which allowed users to see how their responses stacked up against the overall results
November 28, 2018
November 26, 2018
We gave Ligonier Ministries' State of Theology survey results a shiny new update for 2018. Now with 100% more particles! @Nick Walsh wrote about it too! 👉 Updating a Visualization of Likert Scale Results
October 30, 2017
We designed a data-driven experience where users can explore 3,000 survey participants’ answers. Full case study here: https://envylabs.com/work/ligonier