Find designers
Designer search
Quickly find your next designer
Post a job
The #1 job board for design talent
Inspiration
Courses
UX Diploma
Learn UX design from scratch in 6 months
UI Certificate
12-week UI skill building for designers
Live interactive workshops
with design professionals
Jobs
Go Pro
Log in
Dribbble: the community for graphic design
Advance your career with a Professional Diploma in UX Design
Learn more
Log in
Sign up
RSS App
Facebook icon
Share
Twitter icon
Tweet
Copy
8 Shots
•
6 Designers
Daniel Reese
Facebook icon
Share
Twitter icon
Tweet
Copy
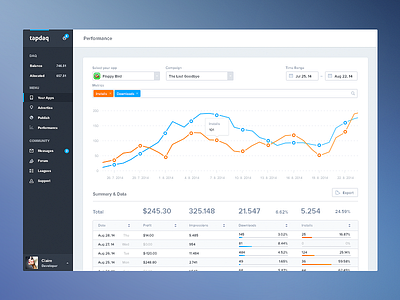
View Performance - Tapdaq v2
Performance - Tapdaq v2
Like
Jan Losert
Pro
Like
635
65.2k
Shot Link
View Animation Transition (Test)
Animation Transition (Test)
Like
Zane David
Like
602
50.6k
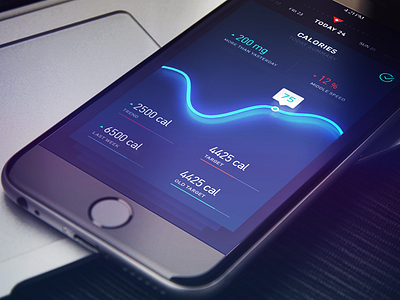
View Line Light Graph
Line Light Graph
Like
Gleb Kuznetsov ✈
Pro
Like
943
80.3k
1
Shot Link
View iPad Dashboard
iPad Dashboard
Like
RALLY
Team
Like
1.2k
134k
Shot Link
View Map Interaction (alt)
Map Interaction (alt)
Like
RALLY
Team
Like
1.3k
110k
Shot Link
View Data visualization / Statistics / Trends Design / graph / graphs
Data visualization / Statistics / Trends Design / graph / graphs
Like
Julien Renvoye
Pro
Like
1.6k
123k
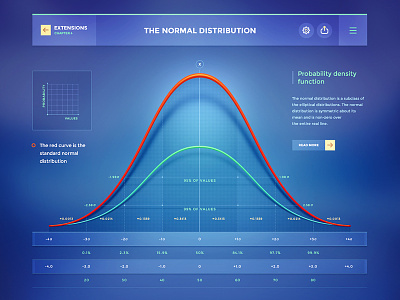
View Probability theory
Probability theory
Like
Mike | Creative Mints
Pro
Like
1.9k
194k
1
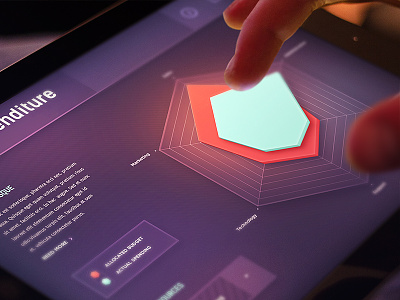
View Statistics (radar chart)
Statistics (radar chart)
Like
Mike | Creative Mints
Pro
Like
3.1k
298k
Sign up to continue
Loading more…
Previous
Next
Loading…