Find designers
Designer search
Quickly find your next designer
Post a job
The #1 job board for design talent
Inspiration
Courses
UX Diploma
Learn UX design from scratch in 6 months
UI Certificate
12-week UI skill building for designers
Live interactive workshops
with design professionals
Jobs
Go Pro
Log in
Dribbble: the community for graphic design
Advance your career with a Professional Diploma in UX Design
Learn more
Log in
Sign up
data viz
Facebook icon
Share
Twitter icon
Tweet
Copy
8 Shots
•
6 Designers
data visualization styles
Jason DePerro
Facebook icon
Share
Twitter icon
Tweet
Copy
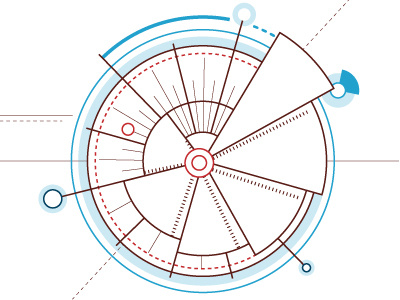
View Exploded Pie Chart 2
Exploded Pie Chart 2
Like
Kevin Chang
Pro
Like
12
2.2k
1
View Exploded Pie Chart (WIP)
Exploded Pie Chart (WIP)
Like
Kevin Chang
Pro
Like
9
2.2k
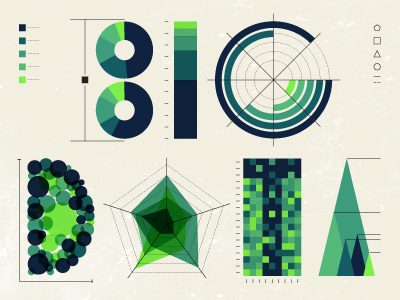
View BIG DATA
BIG DATA
Like
Van Run
Like
152
10.1k
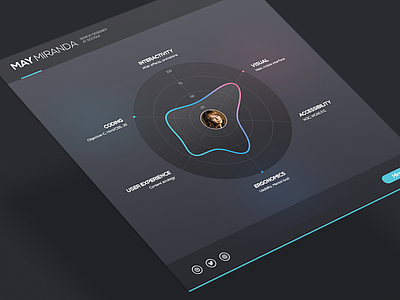
View Designer skills
Designer skills
Like
Aurélien Salomon UX ➔
Pro
Like
542
29.3k
View Accidentally a Tron
Accidentally a Tron
Like
Coleman Collins
Like
8
412
Shot Link
View Foster's Home For More Concrete Statistics
Foster's Home For More Concrete Statistics
Like
Coleman Collins
Like
19
1.5k
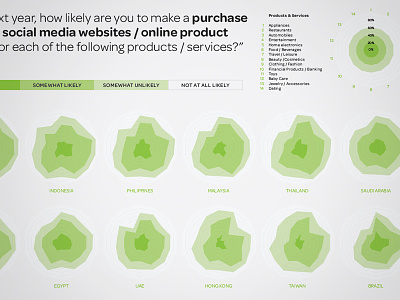
View Consumer Social Media Use
Consumer Social Media Use
Like
Stephen Kennedy
Like
7
1.2k
View Hospital Medicine Index Logo
Hospital Medicine Index Logo
Like
Ian Petty
Like
5
2.7k
Sign up to continue
Loading more…
Previous
Next
Loading…