outage report graph

7n2ydqk0x9ru

7 Responses

  1. Matthew Lyon Matthew Lyon

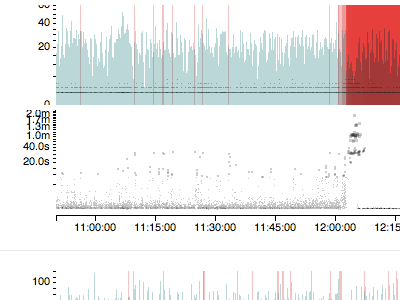
    from a data analysis and troubleshooting tool I built.

    Graphs are drawn in the web browser with the canvas API.

    4 months ago

  2. Pro Greg Dlubacz Greg Dlubacz

    welcome aboard

    4 months ago

  3. Luke Harby Luke Harby

    Super debut

    4 months ago

  4. Pro Mike Busby Mike Busby

    Welcome to the site!

    4 months ago

  5. Wade Meredith Wade Meredith

    Not sure how usable that is, but it sure is pretty. Welcome!

    4 months ago

  6. Matthew Lyon Matthew Lyon

    @Wade Meredith we actually use it internally quite a bit and find it very useful - these graphs are stacked along a relation axis in a way that help us understand the relationships between parts of our system and network, and it's helped us find everything from bugs in our code to configuration issues in our network.

    4 months ago

  7. Matthew Lyon Matthew Lyon

    and, thanks :)

    4 months ago

keyboard shortcuts: previous shot next shot L or F like