Metrics: Over and Under

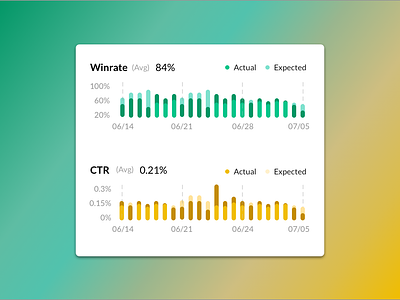

Part of a recent project I've been working on. The goal of the graphs is for a user to easily see when metrics are over or under their expected daily value, and how big the disparity is. This is the scale of the graphs on mobile devices and smaller widgets.


