Data Viz: Area Chart

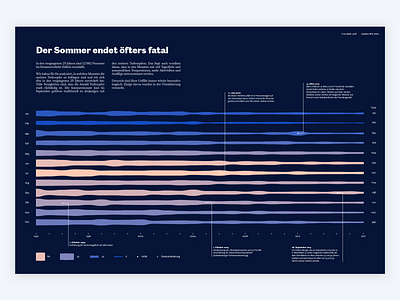

This is a data visualization of 25 years of traffic accident statistics.
I analyzed different aspects of the accidents, for example the number of accidents, the distribution and the development and visualized them with different time focus (hours/days/months/years).
This subject shows the development of deaths in road traffic after months over a period of 25 years. It is No. 2 of a series of 3 visualizations designed for use in monthly magazines.


