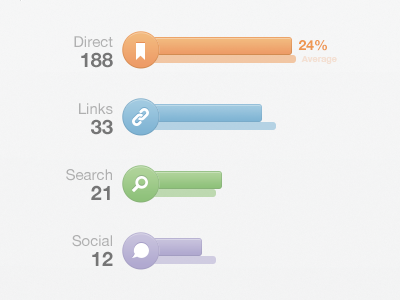
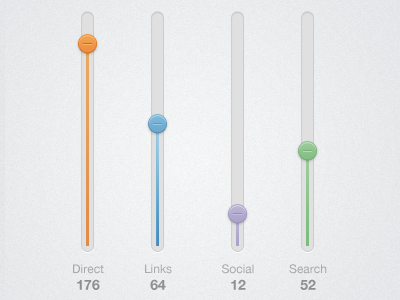
Playing with some different traffic sources visualizations.
You should follow me on twitter for updates.