Line Graphs

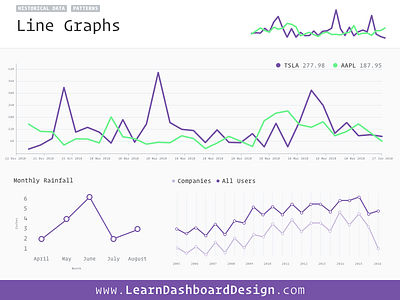
Line Graphs are a great tool for displaying both data over time and patterns. They consist of x and y axis, representing values and intervals. It’s common to plot a number of different lines in one line graph to compare values and recognize patterns.
This can be a powerful way to visualize data, but be careful to not let the data get too complex, dense and cluttered. It’s not recommended to plot more than 4 lines on one graph.


