SurgeMaker · Radial Tree Data Viz

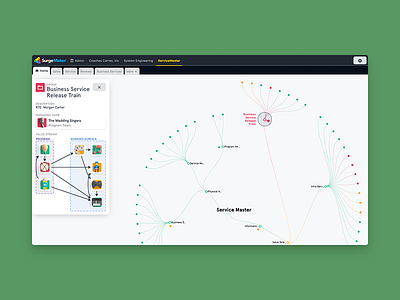

SurgeMaker visualises a massive amount of data: Companies contain Lines of Businesses which contain groups of Teams which contain Indexes, Improvements and Impediments which contain Disciplines, Practices, Observations, Notes and Actions. And all of this is tracked over time and compared to previous scores.
Our approach to guiding executives through this database was to start at the top-level, try and point out something interesting—“Hey, this looks kinda weird, I wonder what’s going on there”—and then guide them down a level. Rinse, repeat, until hopefully they get to the root cause of whatever weirdness they were seeing in the first place.
Essentially, every page of the app is showing the same information, aggregated and displayed in different ways. It’s a similar approach to Google Maps: you’re always seeing “the world”, but as you zoom in you’ll see continents, then countries, cities, suburbs, streets, and places.


