Chartio Explorer

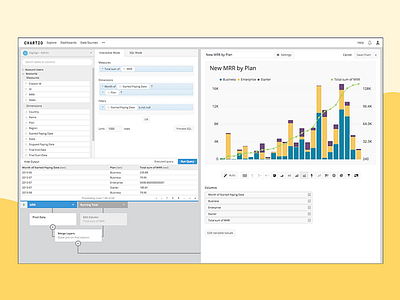
The actual chart creation part of Chartio which I've helped evolve over the years. Chartio features drag-n-drop chart creation, the ability to mix different data sources in a chart, a "data pipeline" for adding transformations to your query via simple "steps" and "SQL mode" which lets a user manually edit the query being generated. We recently added an "Advanced Pipeline" for even crazier queries requiring multiple merges.
You can see more at https://chartio.com/
explorer-moving.mp4
600 KB


