Daily UI #018: Analytics Chart


The Challenge: Design an analytics chart.
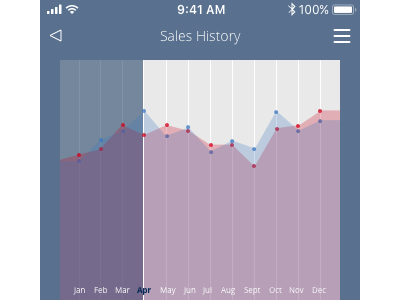
Behind the Design: For this challenge, I designed an analytics chart displaying the retail sales for a company. Here you can find the monthly and yearly sales for the company as well as their overall monthly and yearly profit or loss. You would use the middle bar to click through each retail sales category.


