bookbound chart

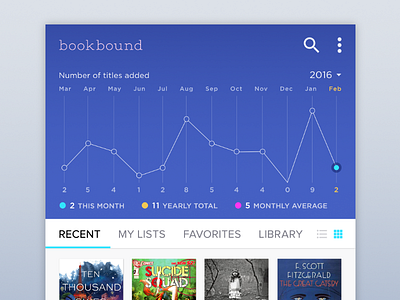
*updated shot with new image* Simple chart that displays how many books read throughout a year. Created for my app, book bound. More details on the project found here
*updated shot with new image* Simple chart that displays how many books read throughout a year. Created for my app, book bound. More details on the project found here


