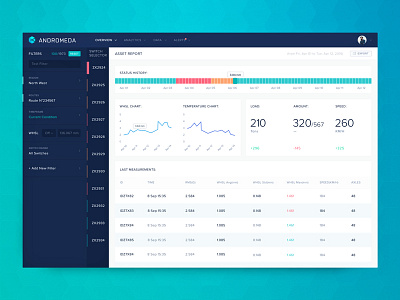
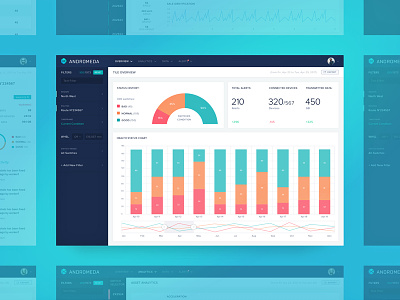
Industrial Analytics Dashboard Group Overview Page


Hey guys!
At Zajno, we’ve been working on a massive industrial product for an awesome IIoT startup that will shape the future of industrial analytics - that’s for sure. This is a screen from the group overview where regional managers will monitor the status of their region. This page shows the stats of how many failures and warnings are there each day, week or month. There are also some general stats.
Our main objective was to have the most important info displayed on this screen, so the data is easy to comprehend. Let us know what you guys think!
Press "L" to show some love!
Don’t forget to follow Zajno on social media and feel free to drop us a line:
Facebook | UpLabs | Twitter | Instagram | Zajno | Medium