municipal bonds by region
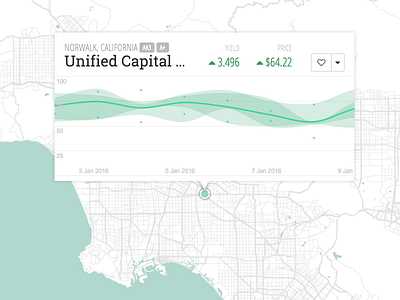
Visualizing bonds by region. Bonds get clustered when there's a lot in one area.
Chart is live visualization of bond price over time. Intervals are used as bond prices are estimated through past bids.
Visualizing bonds by region. Bonds get clustered when there's a lot in one area.
Chart is live visualization of bond price over time. Intervals are used as bond prices are estimated through past bids.


