Lego Data Visualization

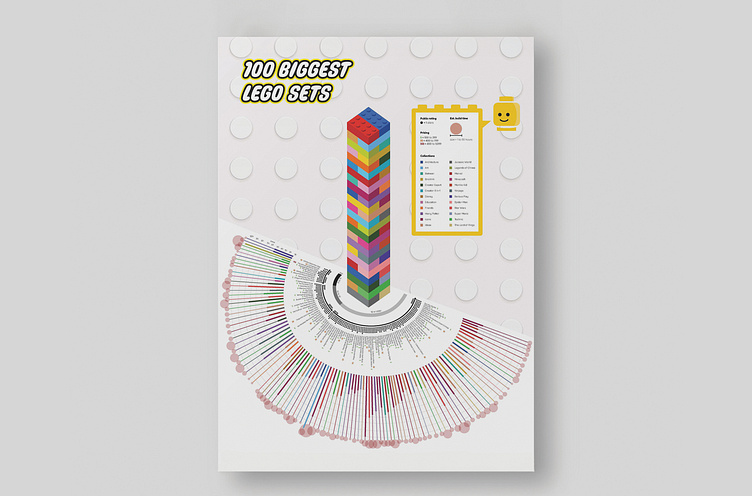
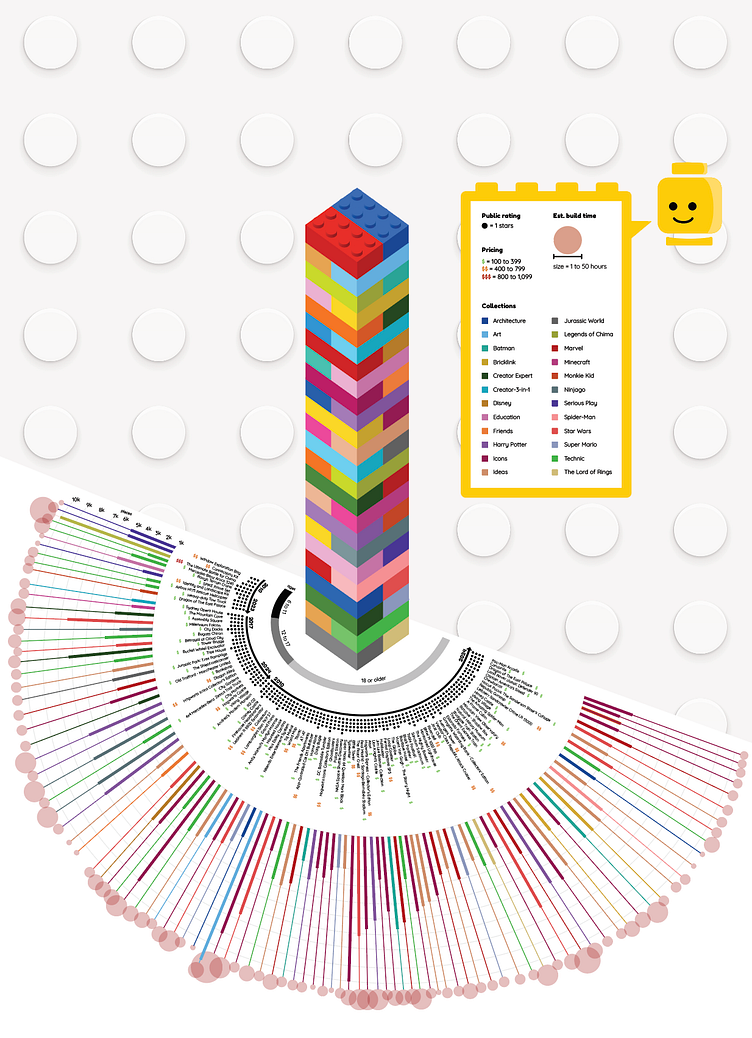
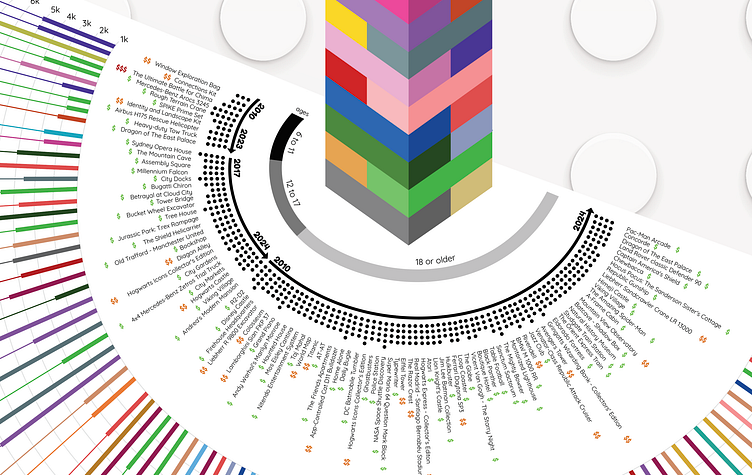
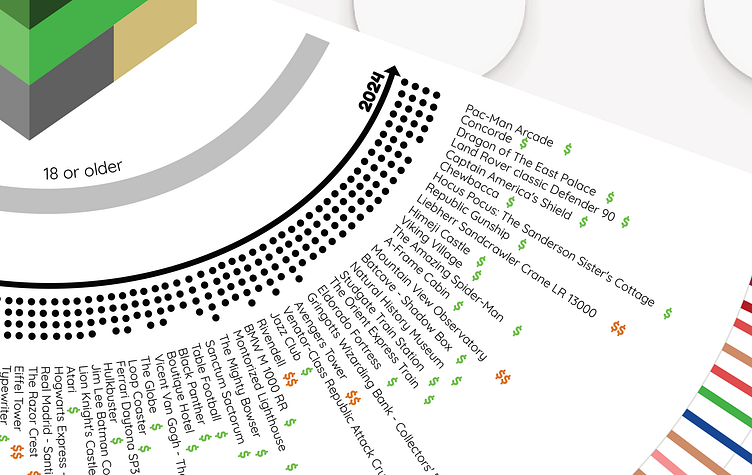
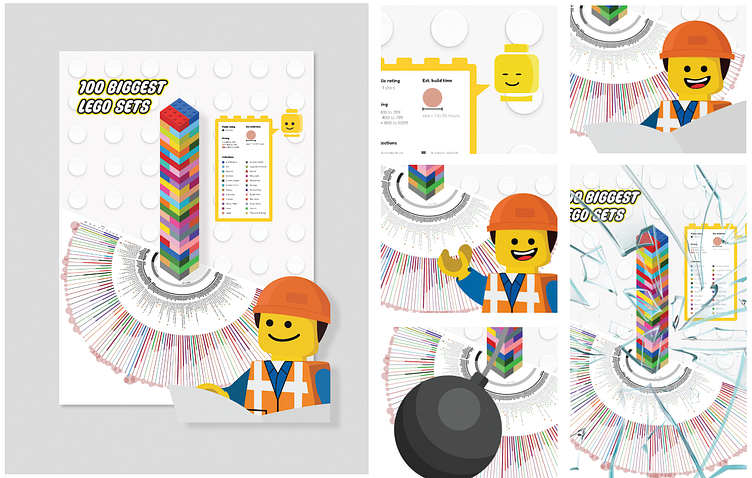
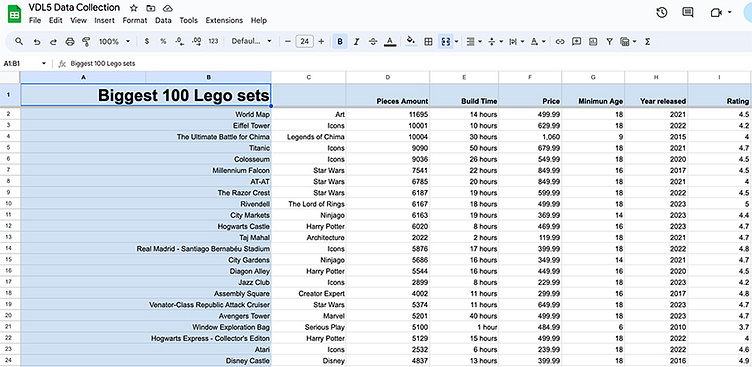
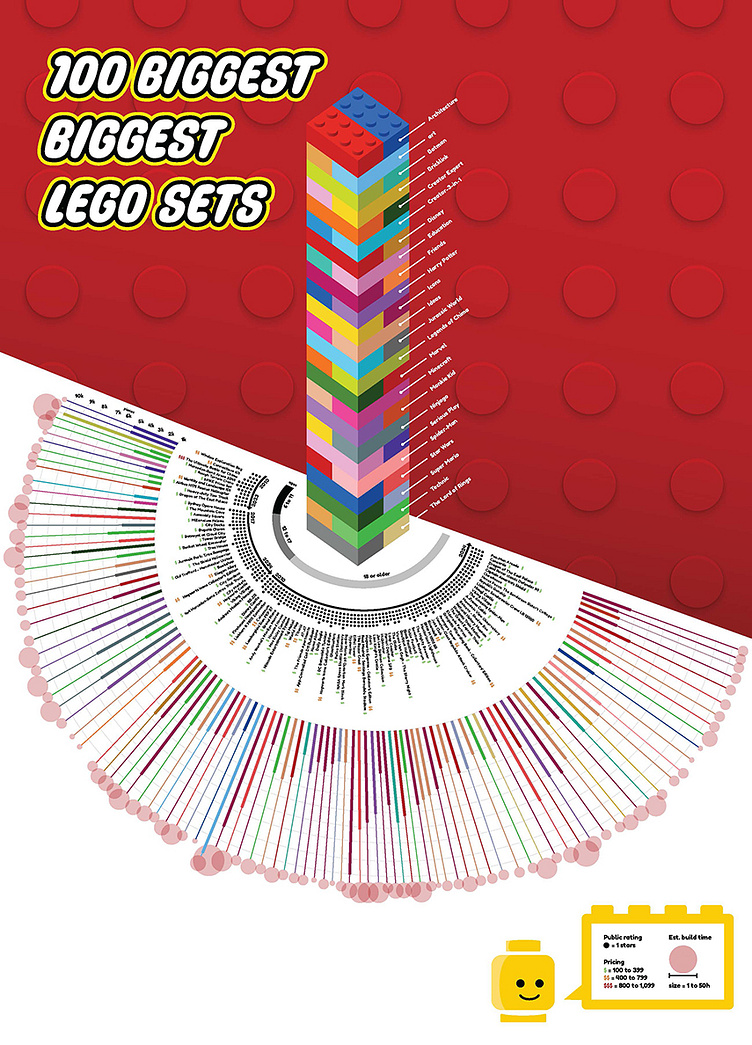
This project consists of a visual representation of collected data for the 100 biggest Lego sets. The data showcases the relationship among all seven categories: year released, number of pieces, type of collection, minimum age requirement, price, time it takes to build, and rating. The hierarchy focuses on displaying the number of pieces each set has using a bar graph as the central focus.
Poster


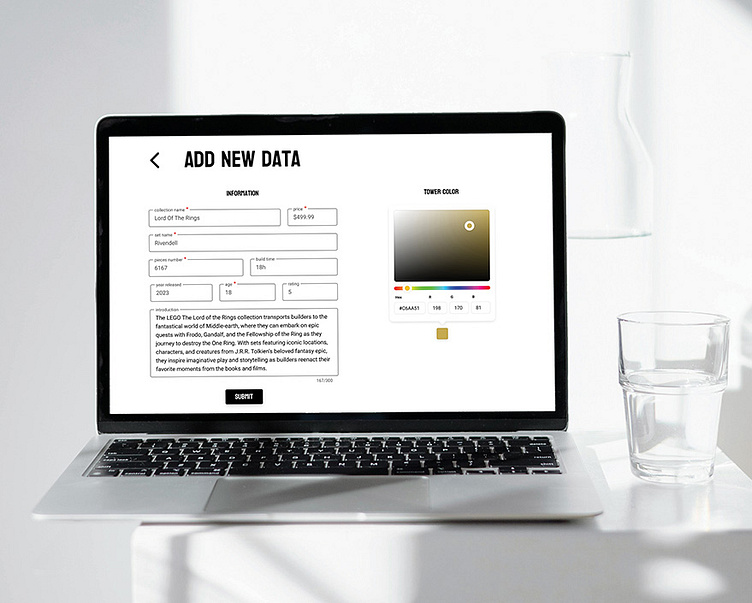
Interface Design
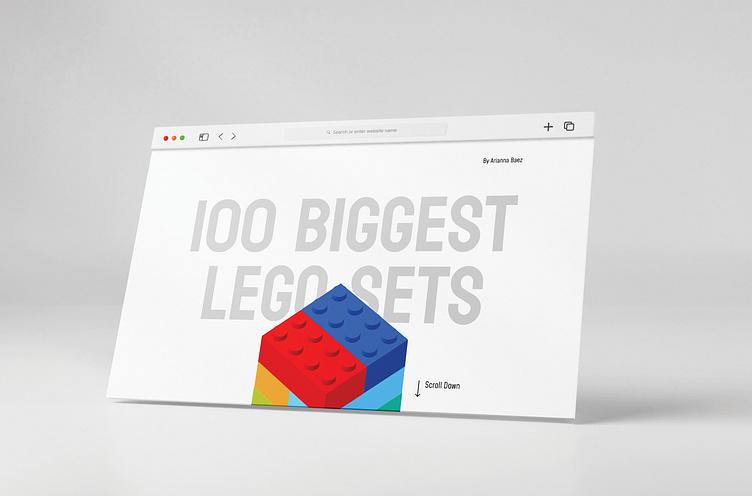
This part is a continuation of the 100 Biggest Lego Data Visualization Poster. It involves translating the data into an interactive interface for further exploration and updates. The website provides easy access and new data addition, while the Augmented Reality component engages the audience with playful animations. Ultimately, the goal is to provide good user experience.

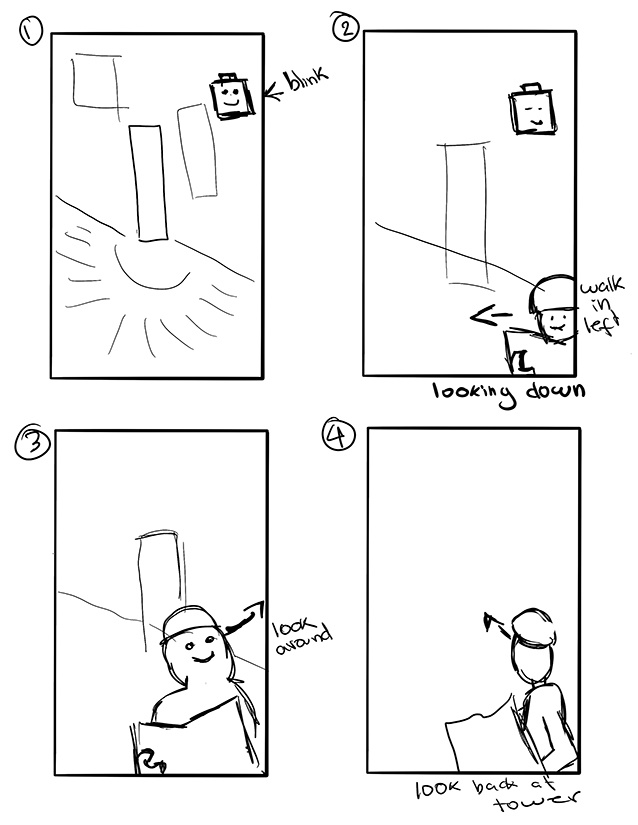
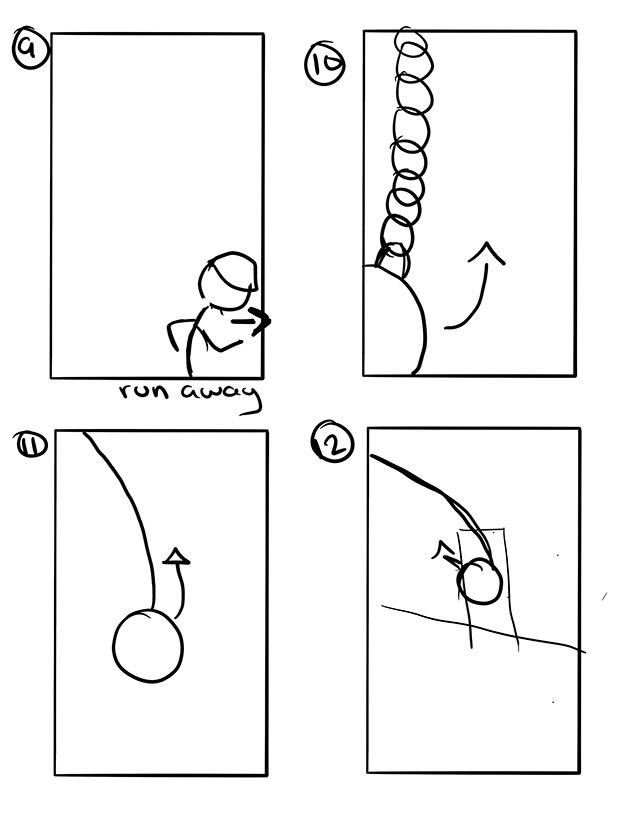
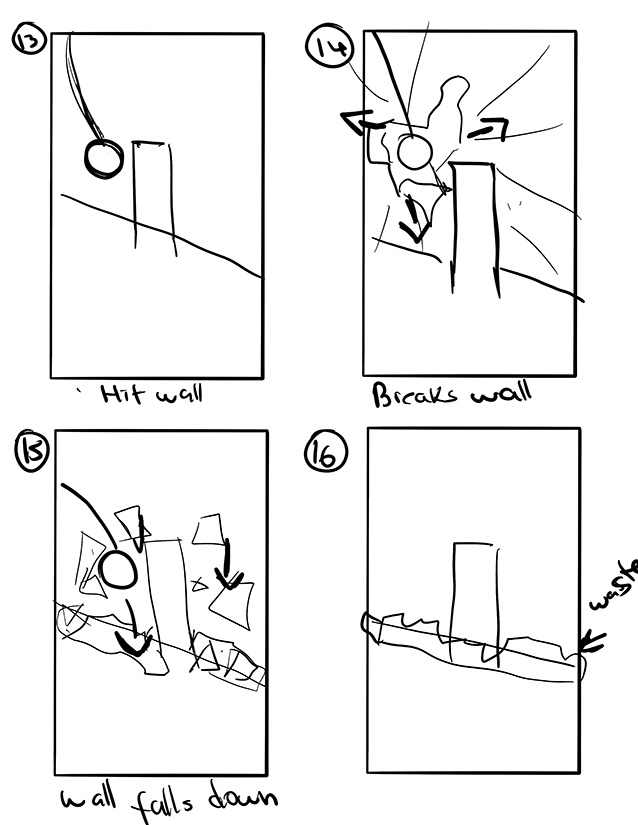
Augmented Reality
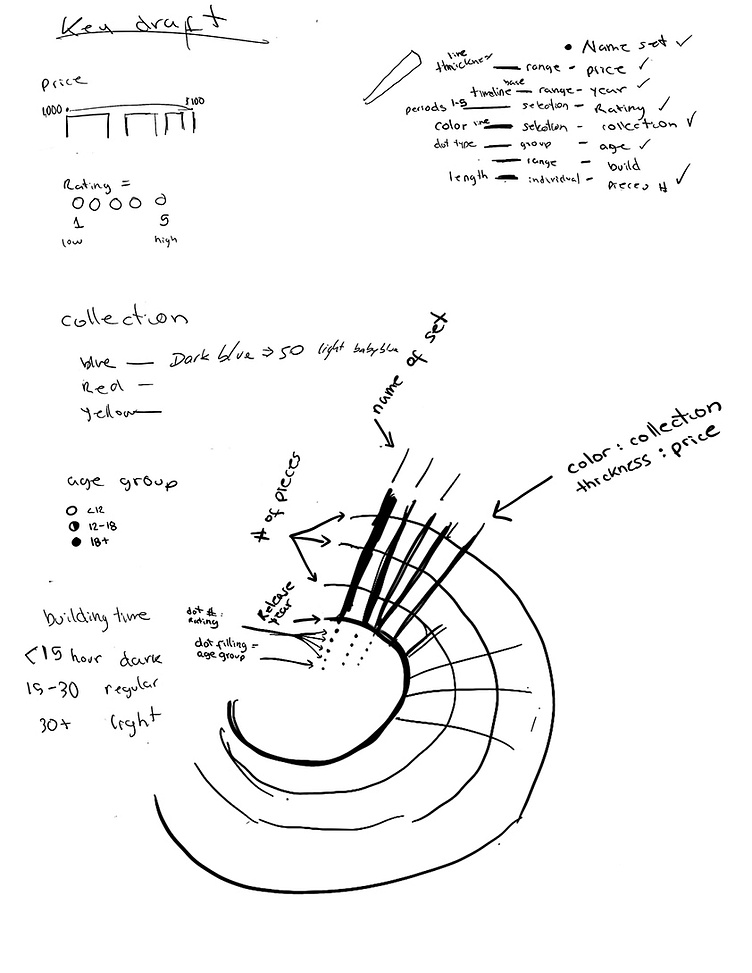
Process
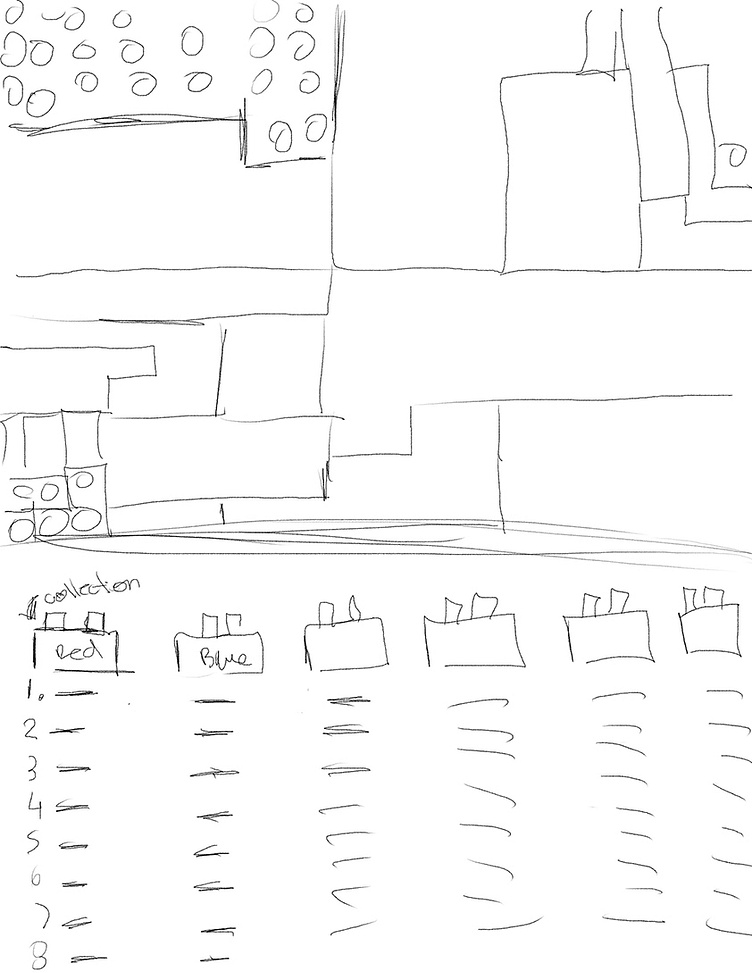
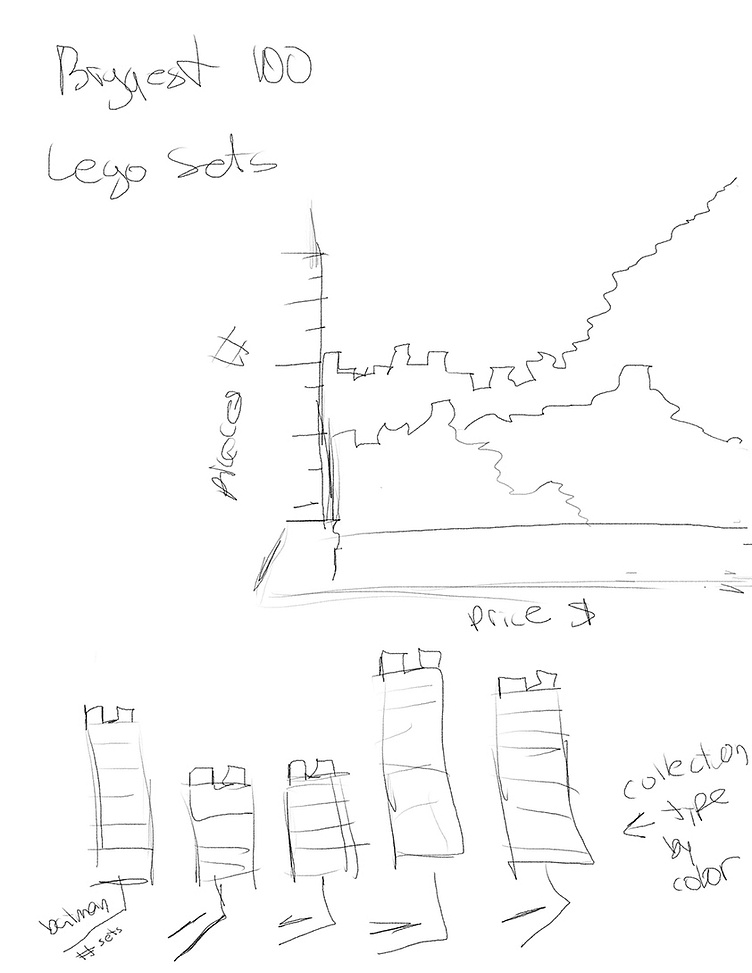
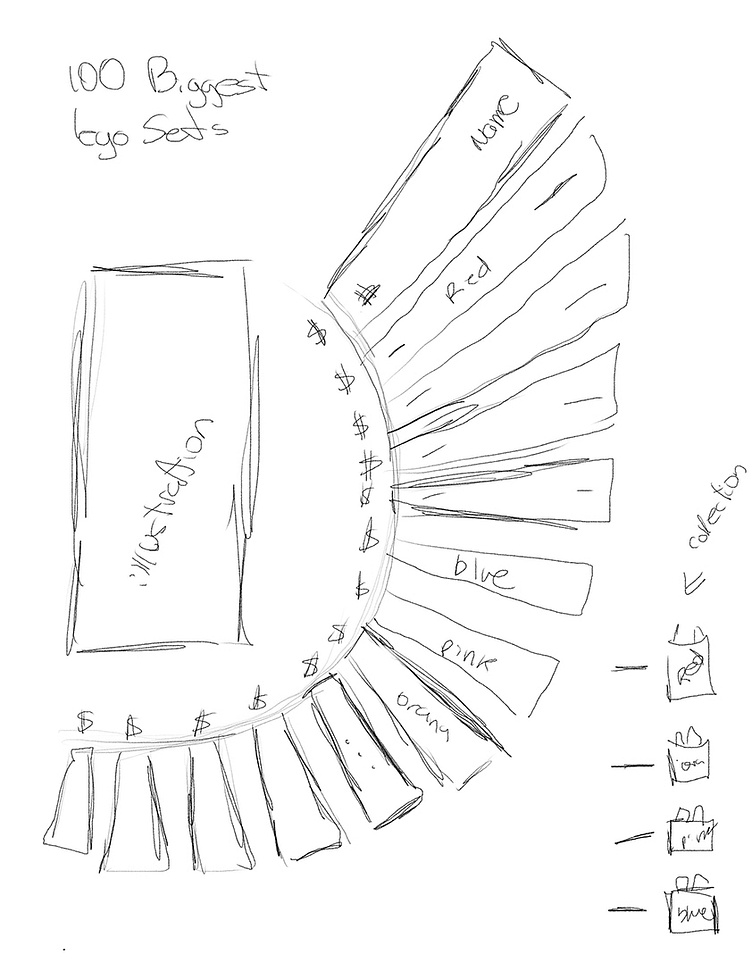
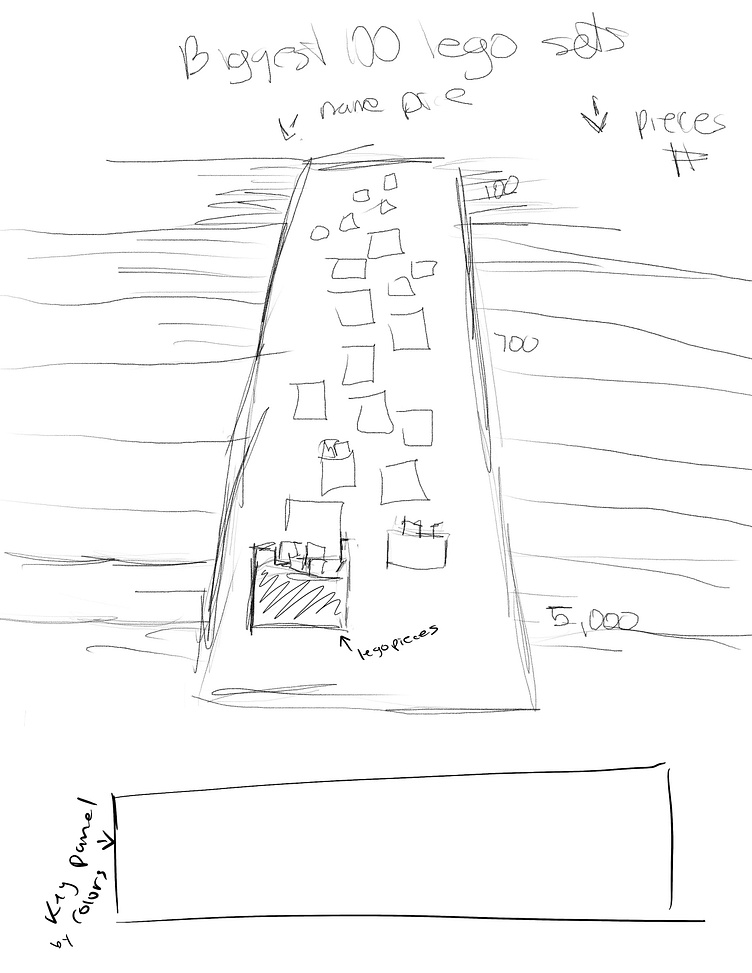
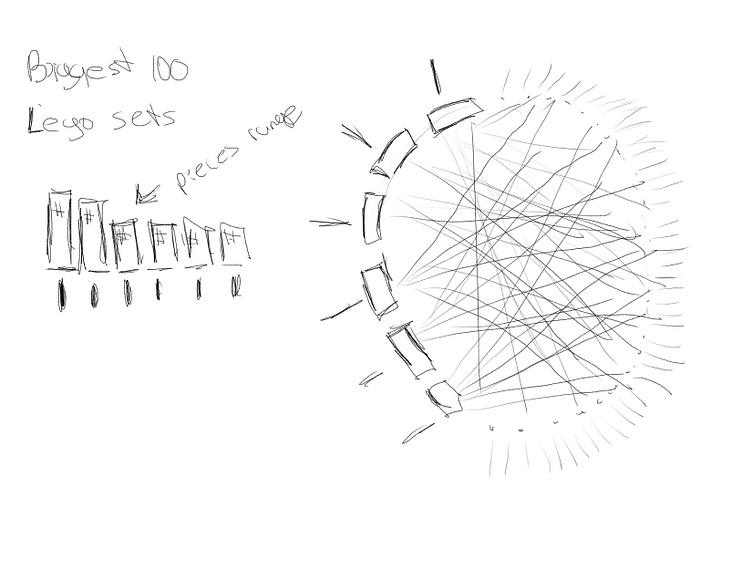
Poster Sketches
Interface Skethes
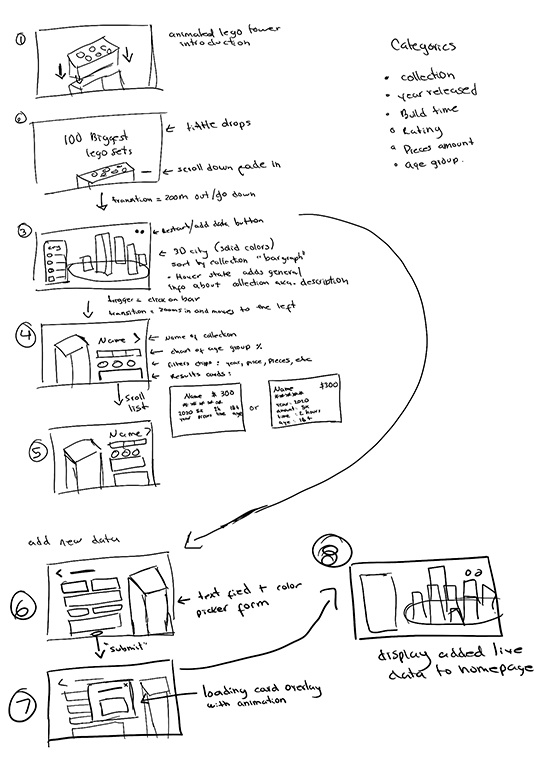
Storyboard AR Animation