Data Visualisation for More Growth (AU)

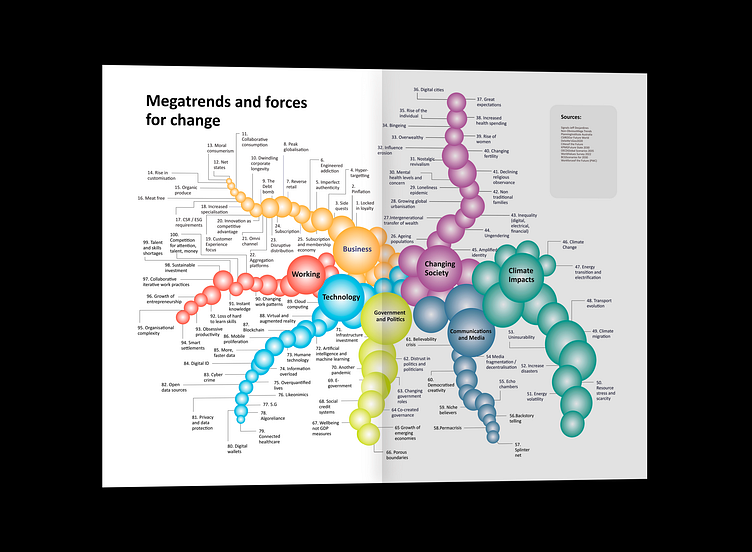
Data visualization chart for More Growth (NGO) Australia, for Four Futures of Generosity publication. The map is inspired by the futurist Richard Watson - the 2009 trend map uses a "multi-tentacled hydra and it presents a trend list: -list of 100 trends - Megatrends and forces for change.


