Data Visualization (Charts)


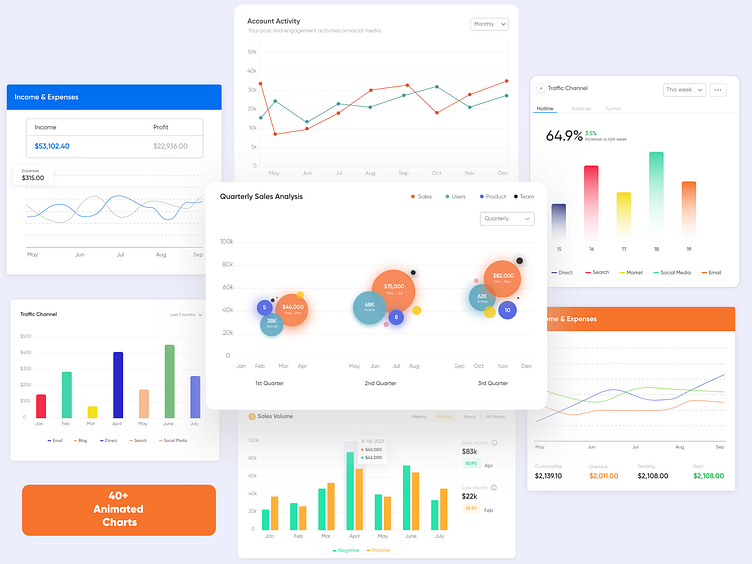

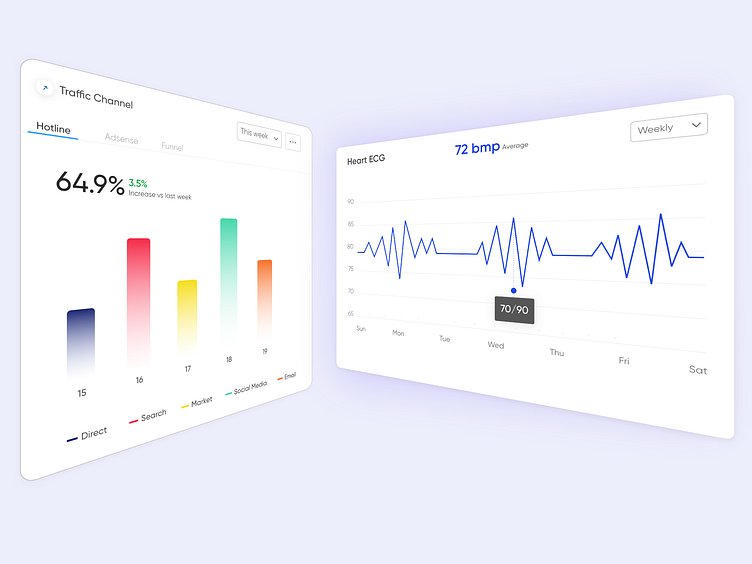
Collections of well thought-out data visualisation charts (bar chart, bubble chart, line chart, area chart, column chart, bullet chart and more), to convey valuable metrics your app has delivered to your existing customers and new potential users with cool charts on your website or SaaS landing page. You can also use these chart as a placeholder for web graphics, ui animation and web motion graphics as you desire. Grab them here https://shorturl.at/kwEIK


