Introduction to the ProjectFlow


In the upcoming posts, I will introduce the concept of a SaaS dashboard for project management and explain its benefits. Additionally, I will provide an overview of the main screens and functionalities of the dashboard.
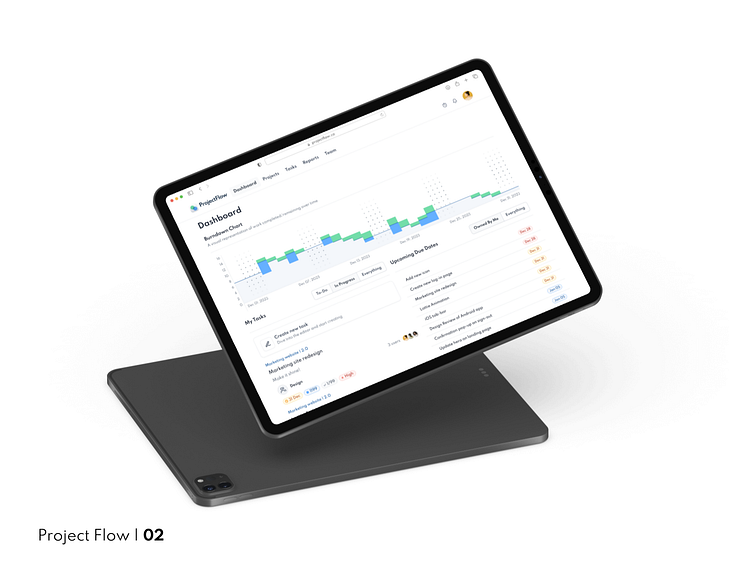
Let's begin with the Dashboard Overview Screen, as it serves as the starting point for every interaction with the platform.
Although it is just a concept and its purpose is to enhance my portfolio, it still needs to incorporate design thinking.
Here is a simplified or condensed version of the design methodology:
Empathise - What is the problem?
Define - Why is it important?
Ideate - How do we solve it?
Prototype - How do we create it?
Test - Does it work?
So let's start with the "Empathise" phase. To save time and avoid the necessity of interviewing people, I've decided to begin with myself. I quickly discovered a problem: I'm using Shortcut (formerly Clubhouse) as the management tool for one of the projects I'm working on, and I constantly struggle with their home page, or let's call it a dashboard. I find myself switching to Stories mode, which is essentially a Kanban board. The problem with the Kanban board is that it only shows the Design team by default, and sometimes I get assigned tasks on the Development team. There have been cases where I forgot or lost a task that was outside my design board. However, the dashboard gathers tasks from all the teams, so it would be more convenient to use it instead of stories. It's a bit far-fetched, but hey, I need something to work with.

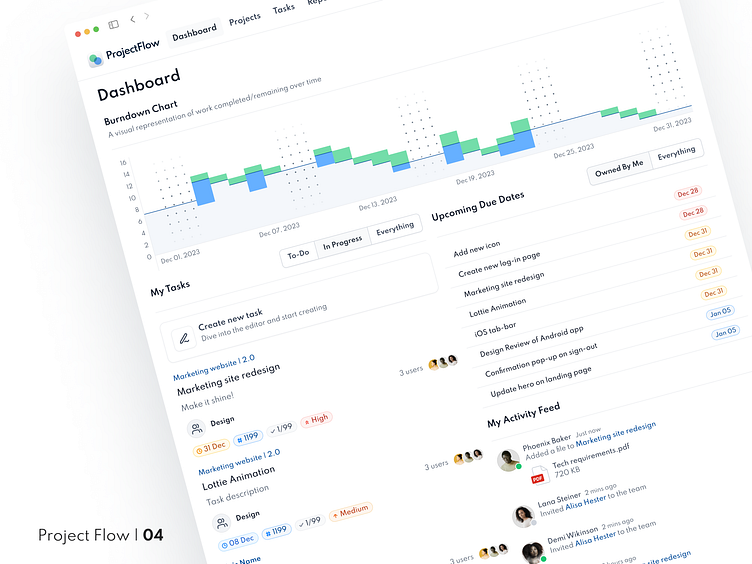
After a few days of trying to force myself to use the dashboard instead of Stories mode, I realized that it's actually not bad. So I decided to keep the overall logic of the dashboard but enhance it with another cool feature of Shortcut - a burn-down chart. Initially, I thought, "Hey, this page looks dull, let's add some kind of chart to it. Everybody loves charts." But then I realized that it's better to provide value with this chart, otherwise, it would be a "form over function" situation. After considering a few ideas, I concluded that a burn-down chart would be a great option.
So, the previous paragraph covers both the Defining and Ideation phases. I have identified a problem, explained why it is important to address it, and proposed a potential solution or something that appears to be a solution.
And now I'm presenting to you my vision of a Shortcut (or any other) dashboard. The main goal is simple: gather all the tasks in one place or, at the very least, show the most important ones, and provide an overall performance chart.
Please feel free to comment and share your thoughts on this. And of course, if you would like to create something similar, just send me a message.
By the way, the overall concept was developed with the help of Untitled UI components. Undoubtedly, it is one of the best UI kits available on the market.


