Gantt chart / plan-fact

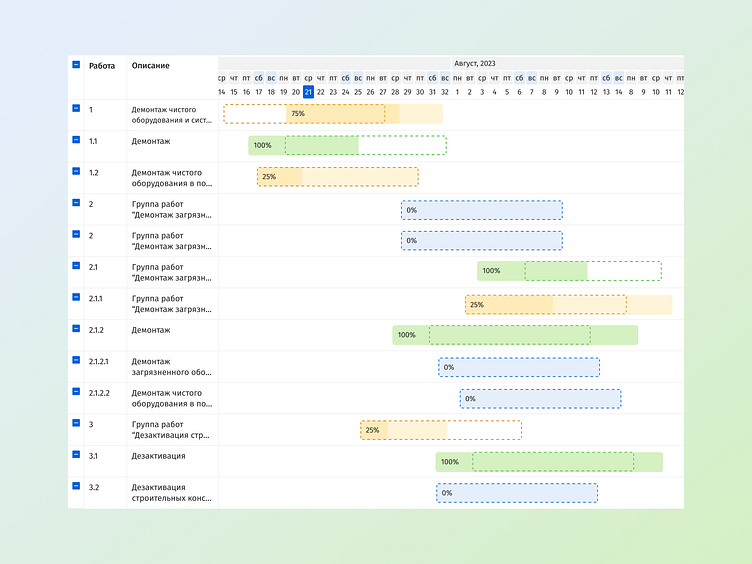
I present to you my vision of a Gantt chart, in which for each task there is a planned execution and an actual one. The actual completion of the task is also determined by the color highlighting: green - 100% completion of the task, blue - 0% completion of the task and yellow - the task is in the process of completion.
Hope you enjoyed this ❤️


