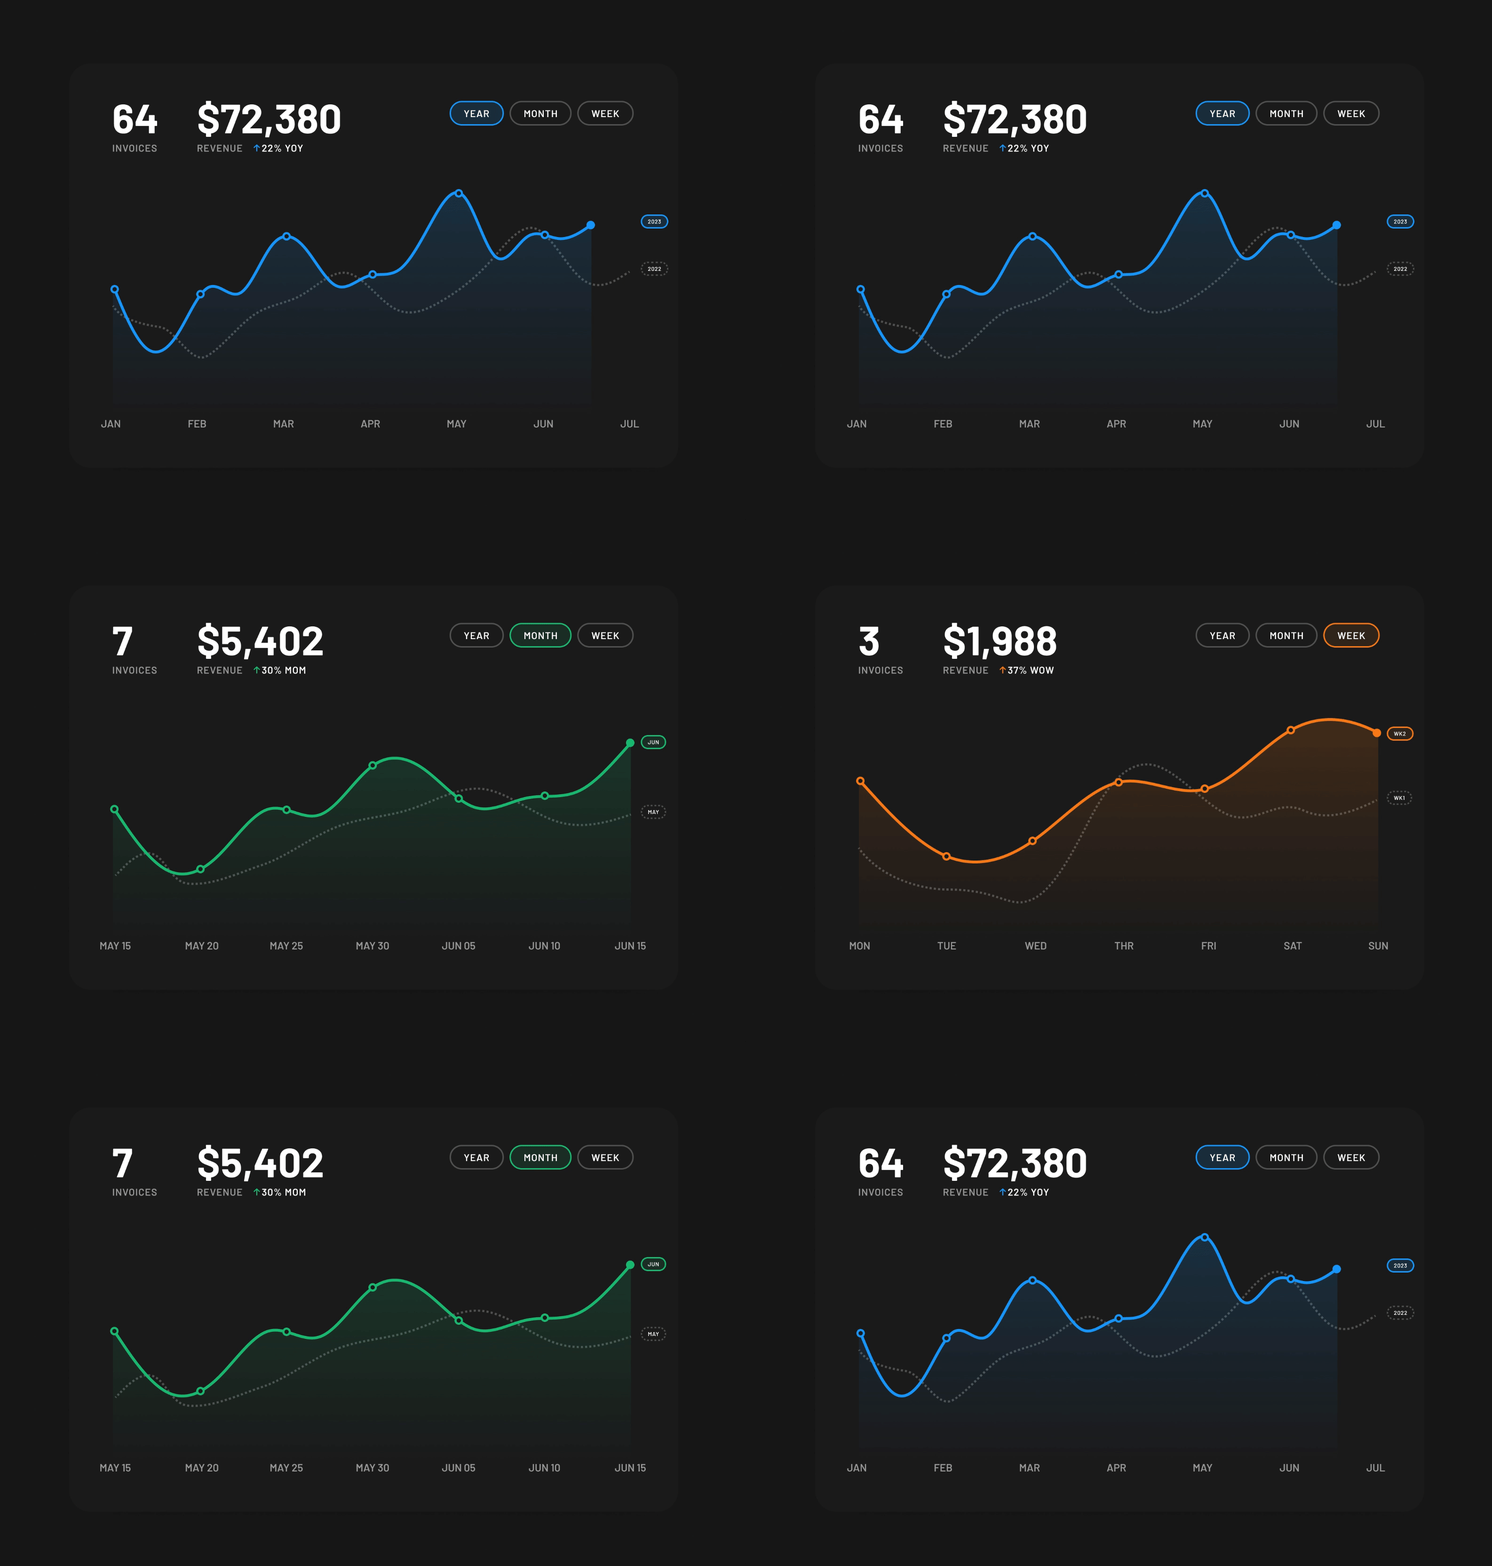
Invoice Tracker - Line Chart Animation (Dark)
Exploring line graph animations to help freelancers track invoices and revenue over time.
Graph highlights:
Track total # of invoices by the year, month, and week
Track total revenue earned by the year, month, and week
Compare year-over-year gain/loss
Compare month-over-month gain/loss
Compare week-over-week gain/loss
This is my first Dribbble shot - Hoping it will help inspire your next project!
chart animation
figma animation
fintech
fintech graph
graph animation
invoice design
invoice tracker
line chart
line graph
View all tags
Posted on
Feb 12, 2023
More by Jeremy Basham View profile
Like


