Learning Analytics on Interactive Tabletops

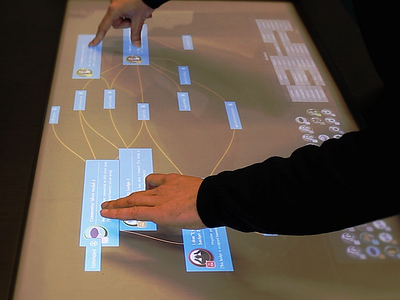
A tabletop application I developed in 2013 for my PhD, which is all about Learning Analytics dashboards. I'm a computer scientist, more specific in the field of Human-Computer Interaction and Learning Analytics, so the work I'll be posting is more focussed on usability, usefulness and effectiveness of data visualisation applications.
As you know, most computer scientists have no design taste. When we look at the code we see "blonde here, brunette there" (yeh that's a Matrix quote ;)), so code is beautiful enough right? Not sure how the Dribbble community reacts to our kind, but I'll make sure to keep hideous (imo) prototypes to myself ;)
Tips, ideas, criticism very much appreciated on all I post!
Related article:
Charleer, S., Klerkx, J., Santos Odriozola, J., Duval, E. (2013). Improving awareness and reflection through collaborative, interactive visualizations of badges. ARTEL13: Proceedings of the 3rd Workshop on Awareness and Reflection in Technology-Enhanced Learning: Vol. 1103. ARTEL13: 3rd Workshop on Awareness and Reflection in Technology-Enhanced Learning. Paphos, Cyprus, 17 September 2013 (pp. 69-81) CEUR-WS.


