Project - Echelon


Hi, Everyone
We are excited to share with you the user interface designs we have done for our Organizational Strategic Planning Tool.
Design Challenge
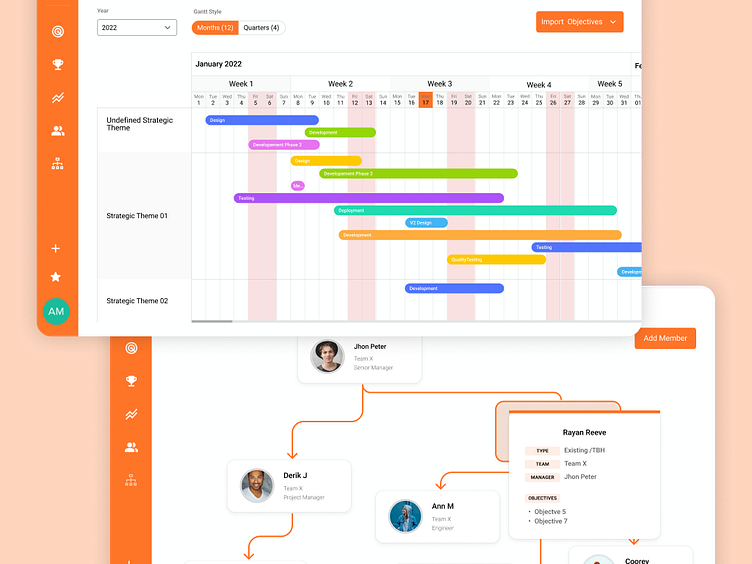
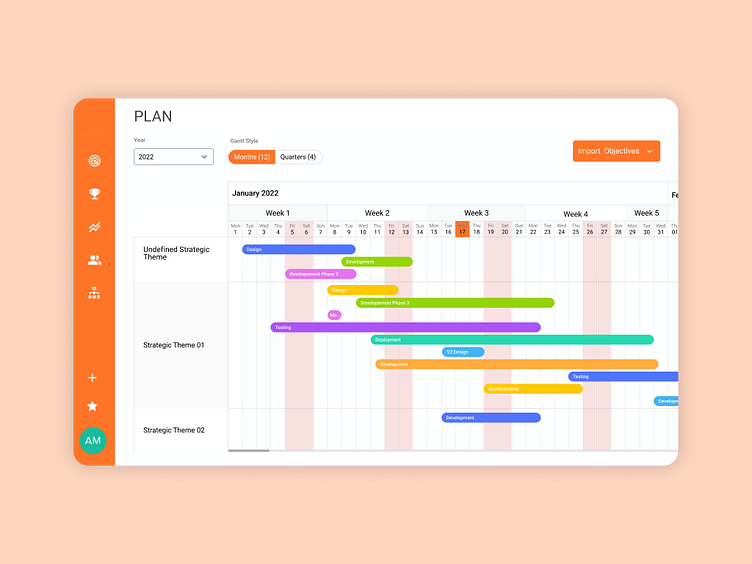
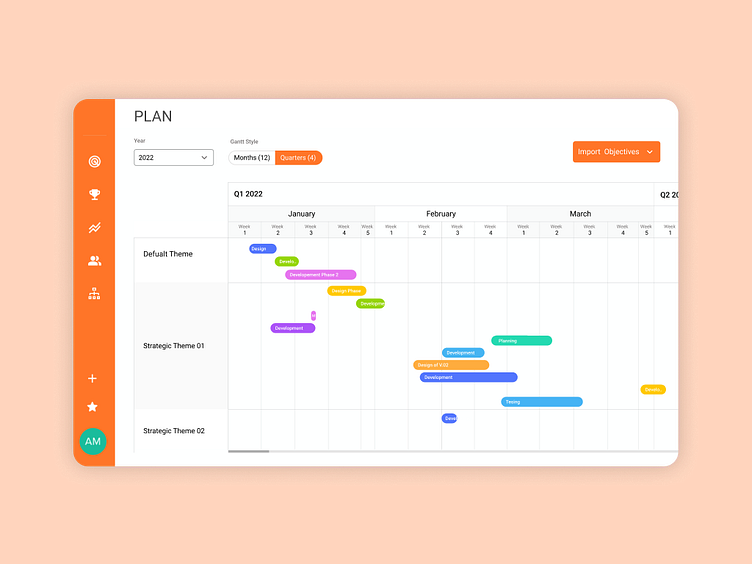
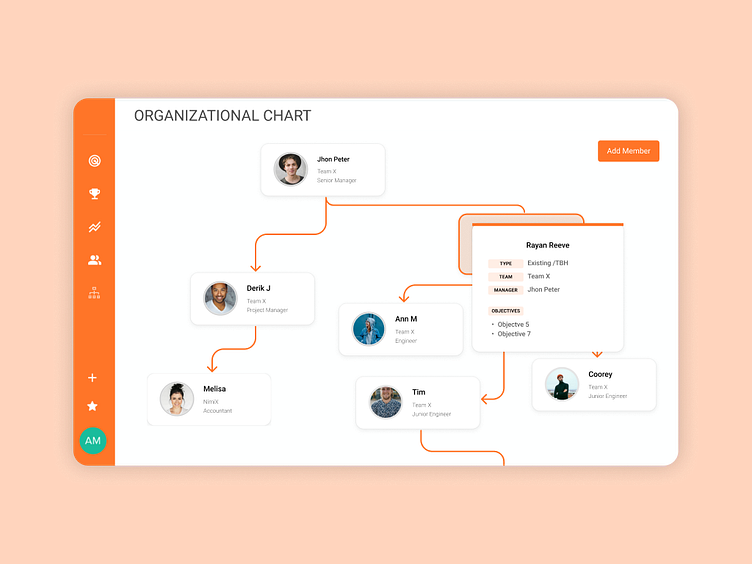
Showcase organizational strategies and objectives in a Gannt chart. Our Clients wanted to view their target objectives year by year, monthly & quarterly in the Gantt chart. Another design need was to view all the employees in the organization in an hierarchical order while mapping the objectives assigned to them. Considering all technical possibilities our challenge was to make their design expectations into a reality.
The Solution
We were able to design the Gantt chart user interface for both monthly view and quarter view to display the objectives of each organizational strategy. The final set of UIs with optimized UX were created to match the development and technical capabilities.


