Financial Dashboard View - Heat Map
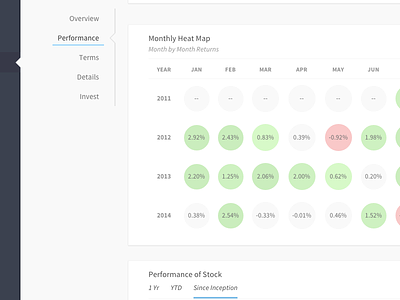
Some elements of a dashboard for a finance app. This is a monthly display of returns, shown as a heat map. The bubbles grow to draw focus on hover / tap.
Some elements of a dashboard for a finance app. This is a monthly display of returns, shown as a heat map. The bubbles grow to draw focus on hover / tap.


