Analytics Chart

Hi, everyone!
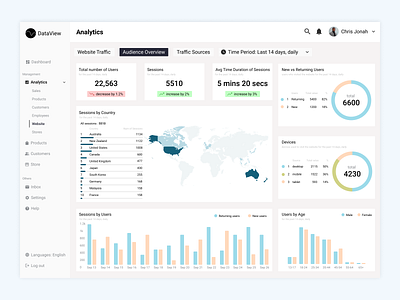
Here is my attempt on the DailyUI Challenge for day 18 - Analytics Chart.
This page focus on the users who have visited the website for the past 14 days. It contains the total number of users, number of sessions, average time duration of each session, number of new and returning users, number of devices used by users and the number of users by age between male and female users.
Feel free to check out my other work as well! Thank you! :)


