Website Analytics Data Visualization

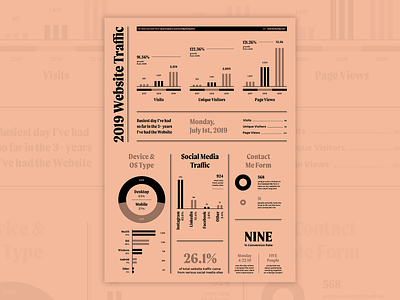
This is my 2019 website traffic visualized into an infographic. With the quarantine, I had enough time to get to this!
This is my 2019 website traffic visualized into an infographic. With the quarantine, I had enough time to get to this!


