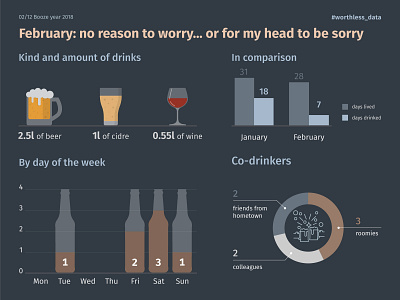
Infographics 'Booze year 2018. February'

Worthless data is a fun project which I started at the beginning of 2018. The year before I quit my job at an infographic studio and I was missing this kind of work. I didn't have strong skills in data visualization, but it was my big passion and I wanted to advance in that area. I decided to take up a challenge and started doing research that helped me to learn new skills and do what I enjoy.


