COVID19 Dashboard


I'm glad to share my product design suggestion for the COVID19 Dashboard. (Originally designed by the Center for Systems Science and Engineering (CSSE) at Johns Hopkins University (JHU)). Doing my share to fight the Coronavirus!
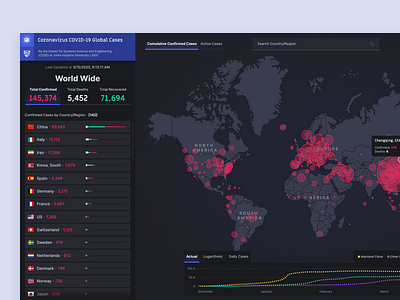
After seeing this dashboard a few times in the news, I felt the need to improve and enhance the data consumption and the interface structure. I've implemented the following features:- Presenting the aggregated data in one section, allowing new filtering capabilities:- Presenting different types of data on the Map.- By selecting a country the user will be able to view a list of all the states and regions within the selected country.- From the counties section, the user is able to view the country status of the epidemic spread, death, and recovery status in comparison to other countries.- Enhancing the history graph to have a timeline capability that can be manually dragged to see the epidemic spread over the timeline.- Adding a search capability.
Thoughts on sorts of data that could be valuable as the epidemic continues to spread:- Trends (Currently some countries are starting to contain the epidemic while some experience a massive spread).- Predictive analytics.- Epidemic routes - How the epidemic reached every region.- Advanced filtering options (by continents and regions), could provide a better understanding of the trends.
I'd be glad to hear your thoughts.
The link to the COVID19 Dashboardhttps://www.arcgis.com/apps/opsdashboard/index.html#/bda7594740fd40299423467b48e9ecf6


